That was the response of a certain Nobel Laureate when I tried to get him to read my paper “A Quant Approach to Tactical Asset Allocation.” He refused to even take a look at it.
This year has certainly been the perfect storm for buy and hold investors. Everything has gone down – Sotcks, Foreign Stocks, REITs, Commodities, and (some) bonds. This has been an instructive year to showcase the benefits of a market timing solution, namely, risk management and avoiding large losses. I have no idea how big this decline will be or when it will end, but it is instructive to take a look at some historical relative performance of the timing model vs. buy and hold investing.
October 1974 ended a period where buy and hold had its highest drawdown ever at around -20%. That has now been eclipsed by the current -30%+ drawdown. (The max timing drawdown is around -10%.)
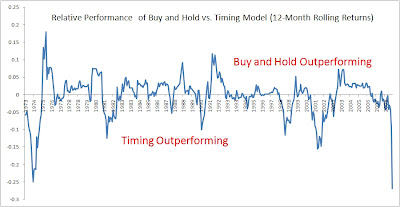
Below is a chart for the relative returns of buy and hold vs. the timing model. Readers know that both have similar compounded returns over the past 36 years, but that the timing model has much lower volatility and drawdowns. Usually one outperforms the other by a maximum of around 10% before mean reverting. (Click on the chart to enlarge)
However, in times of severe market stress (now), the timing model can outperform by far greater amounts. As of the end of October it was outperforming by about 27%. Has there ever been a period comparable?
By October of 1974 the timing model was outperforming as most asset classes were declining severely (with the exception of commodities). The timing model ended the year with a gain of around 13% vs. a loss of -12% for buy and hold. However, buy and hold mean reverted over the next year, and returned about 20% for 1975 while the timing model would have done about 2%.
The million dollar question is, how bad is it gonna get?
(Stay tuned to a follow up post on some thoughts I have here.)


