I was flipping though Mike Carr’s book again the other day, and decided to download the monthly data for the Fidelity Select Sector funds from Yahoo. (Part of the reason was due to my frustration with the state of asset class testing software that I did a post on the other day).
I reran my simple rotation system on the universe of 23 funds that had data back to 1988. Results were broadly similar as those in my book, albeit with higher drawdowns. (These all are equity funds, so they lose the diversification benefit of including bonds, etc). This test was meant to be instructive rather than exhaustive.
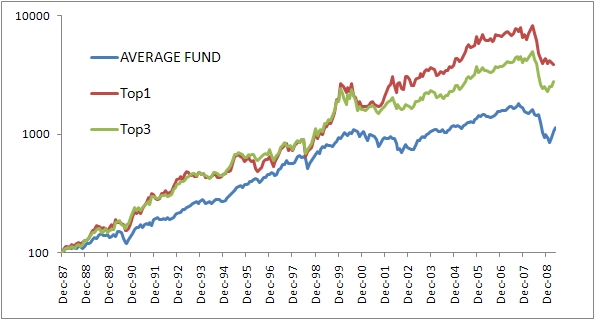
Simply taking the top fund, updated monthly, based on the average rolling 3/6/12 month performance resulted in compound returns of 18% per year, vs. 10% for the average fund.
Simply taking the top 3 funds , updated monthly, based on the average rolling 3/6/12 month performance resulted in compound returns of 16% per year, vs. 10% for the average fund.
Both systems had similar volatility and drawdowns (54%, occurring in 08/09) as the underlying funds (average of 61%).
I think Fido has some screwy rules for holding their funds, but I see no reason why this wouldn’t work splendidly with a diverse portoflio of ETFs or mutual funds. The sample 5, 10, 20 fund allocations from my book would be a good start.


