I spend a lot of time talking about asset allocation on the blog. I’ve presented quant systems that focus on price based tactical asset allocation, cross-market momentum strategies, and mean reversion strategies (just to name a few). Some older posts are:
A Quantitative Approach To Tactical Asset Allocation
Mean Reversion After Really Bad Months
Asset Class Returns Based on Fed Policy
Inflation and Asset Class Returns
I was originally going to put this out as a white paper, but seeing that I have about 5 of those on the back burner (and this seems to be a pretty well known property), I thought a simple blog post would do.
Below we examine the effects of the yield curve on our group of asset classes.
(Data sources: Global Financial Data)
US Stocks – S&P 500
Foreign Stocks – MSCI EAFE
Bonds – 30 Year US Govt
Commodities – GSCI
REITs – NAREIT
Spot Gold
Buy and Hold is an equally-weighted, monthly rebalanced allocation to the above 6 asset classes.
First, we examine how the 10 year US Govt Bond – 90 Day Tbill rate affects the return of various asset classes. We selected three modes, but by no means are these optimized or optimal. The table below presents the % of time spent in each mode, as well as the annualized returns for the annualized returns for the asset classes.
One could devise a simple timing system based on these properties.
When the yield curve is <0%, long commodities and gold.
When the yield curve is 0 – 2%, long us and foreign stocks.
When the yield curve is >2%, long bonds and REITs.
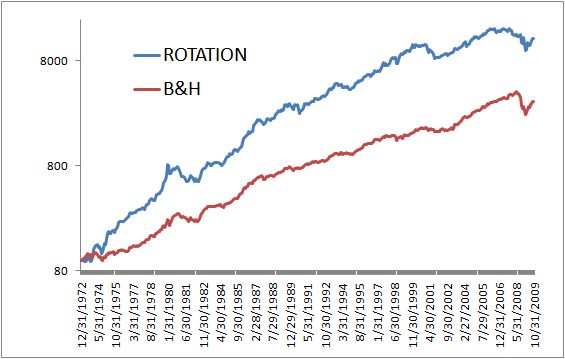
This simple system would have beaten buy and hold by over 4% a year over the time period with more volatility (mostly upside) and a similar drawdown. Equity curve below:
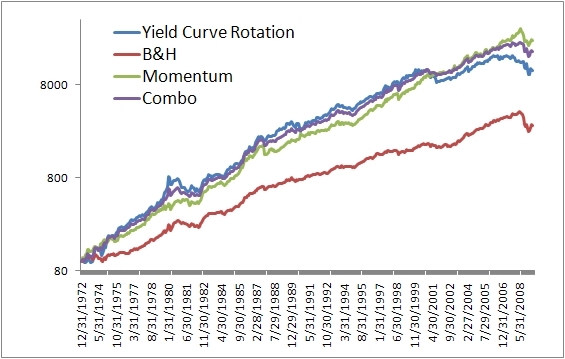
And since you asked, here’s the chart with the momentum rotation system added with a simpler combo of both too:


