Do these markets have you feeling a little crazy lately?
I have received lots of emails and calls recently, and while the questions are varied, they can be summarized as:
“What do I do?”
My usual response is along the lines of: “Develop a policy that you are comfortable with, and apply it with discipline. Then when you are faced with times like these, you will sleep well and know that you have a plan.”
For some that means a diversified buy and hold rebalanced yearly, for some it means all their money in hedge funds, for some it means all their money in CDs, while for others that means a quantitative tactical approach. The approach has to be tailored to the individual, but most importantly, is designed to avoid the subjective “What do I do now?” moments.
—-
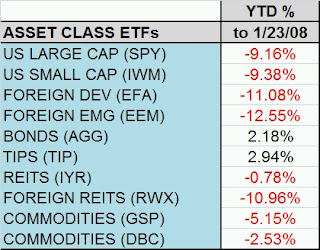
A few indices are flirting with month-to-date performance nearing their worst month performance ever historically. Below are 10 ETFs YTD performance as of 1/23/08:
I wanted to conduct a study that examined performance after the top ten worst months for each asset class, and resulting 1,3,6, and 12 month performance. (The 10 worst months happens about about 3% of the time, or once ever three years per asset class.)
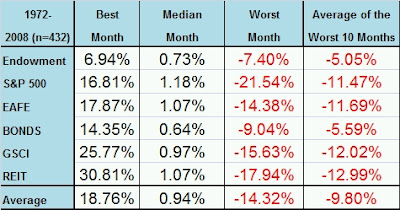
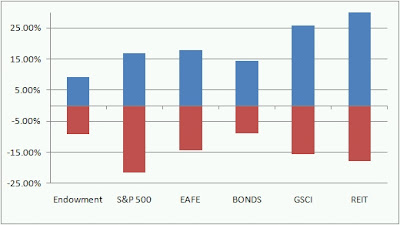
Below is a table and chart of each asset class, and the historical (since 1972) best and worst month (out of 432 months). The next column is the average of the 10 worst months. Endowment is an equal weighted portfolio of the other five asset classes. Most of the individual asset classes, with the exception of the less volatile bonds, experience worst 10 months around 12%, and worst overall month around 15-20%. (Obviously the further back you go, the more extreme the numbers will become. For US stocks it is closer to -30% since 1900.)
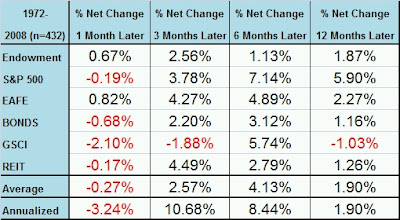
The next question is, “After big down months, what should an investor do?”. Below is a table of returns following the 10 worst months in each asset class. The returns are NET of the median return for the entire sample period. For example, the 1 Month Later figure for the S&P 500 is -0.19%. That means after the 10 worst months on the S&P 500 since 1972, the average return one month later (minus the median 1 month return over the entire period) is 0.98% – 1.18% = -0.19%.
This simply means that had you bought the S&P 500 after a really bad down month, you would have done worse that buying it any other month over the time period. i.e. you should not be buying more.
What are the key take aways?
– It does not pay to buy an asset class after a really bad month for the following 1 month.
– 12 Months later the return is not much different than average.
– 3 and 6 month returns, however, are stronger. You pick up on average about 3-4% abnormal returns buying after a terrible month. That annualizes to about 10% per annum.
A simple strategy would be:
After an asset class has a terrible month (ie MSCI EAFE in January), wait a month then take a 2 month position. i.e. buy March 1 with a two month hold.


