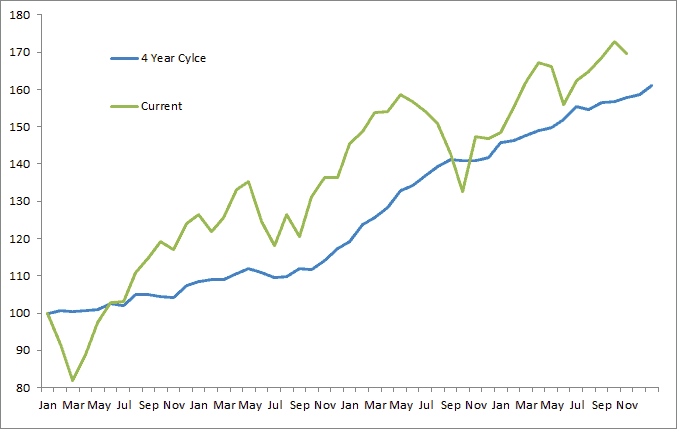
This is a paper we put out back in 2010, and I think it is a really fun read. It combines the January Effect in small caps with the four year Presidential Cycle.
Feel free to play around with this on your own, all the data is free over on French Fama.
Politics and Profit (PDF)
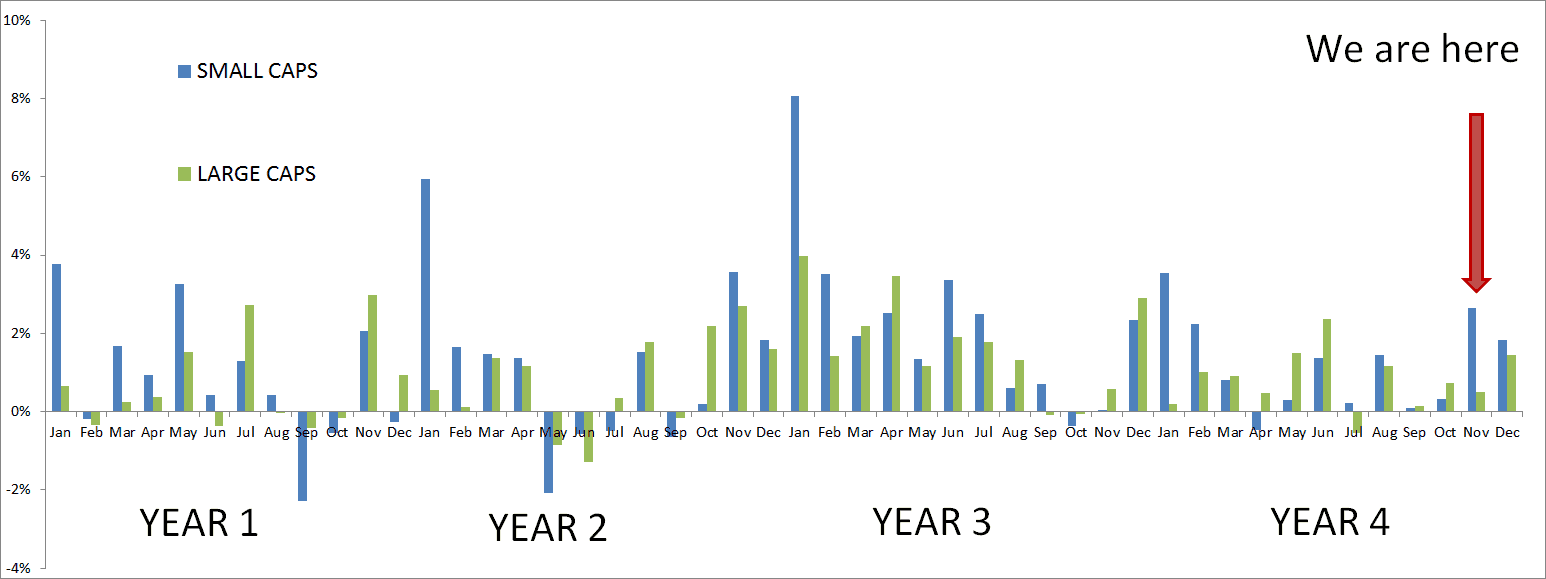
Below is a chart of all months median returns across the 4 year cycle since 1926 (Hi30 and Lo 30). Year 1 and 2 (ie 2013 and 2014) tend to be pretty marginal for for large caps (although mid and small are better especially in year 1). Perhaps we will see continued selling of the large caps, especially big winners and dividends ahead of the tax rate hike?
Article from Steve Sjuggerud also on the topic…


