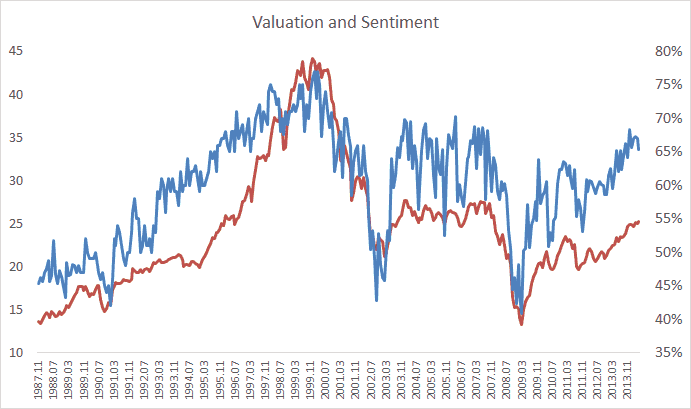
I had not seen the website Street Talk Live before, but it has some nice charts. One was a long term chart of the AAII stock allocations. Nut surprisingly, but sentiment correlates pretty highly with valuations. But then again both of those are dominated by the P.
Below I recreated the chart with valuations on the left axis (CAPE), and stock allocation on the right (AAII).


