Today, we have good news and bad news.
Well, not so much “bad” news, as sobering news.
Of course, the silver lining of this is when you understand this sobering news and allow it to temper your investing expectations, you’re more likely to benefit from the good news.
Enough vague introduction, let’s jump in with the good news.
Most people invest in stocks. They believe that, given enough time and compounding, saving and investing results in massive wealth.
Fortunately, this is true.
At 10% returns per annum you 10x your money in 25 years, and 100x it in 50. Think about that.
$10,000 turns into $1 million bucks with enough time.
But let’s quickly ruin this good news with the sobering news…
Most people are woefully unprepared for the roller coaster ride to get to the pot of gold at the end of the rainbow.
To illustrate, I asked my Twitter followers, who, given what I tweet about, have to be engaged investors and most likely, are professionals, the following question…
What stretch of underperformance by stocks vs. bonds would you be willing to tolerate before selling your stock allocation?
— Meb Faber (@MebFaber) February 6, 2020
To double check the response, I phrased the question a slightly different way with a similar outcome:
Would you be willing to invest in an asset that historically outperforms bonds by a few percentage points per year, but has, multiple times, generated zero outperformance for stretches lasting over 30 years?
— Meb Faber (@MebFaber) February 6, 2020
Most people could only go a short amount of time before throwing in the towel. The correct answer to “What is the longest stretch of stocks underperformance vs. bonds?”
68 years.
Let that sink in. You could theoretically go an entire lifetime and not see ANY equity risk premium.
Now, this 68-year stretch occurred over 100 years ago, so you might be tempted to dismiss it.
Well, in modern times, there have been multiple periods in which stocks have underperformed for decades. (And this is just in the US…other countries have suffered far, far worse…) Given the results of my Twitter poll, this means many respondents would be bailing on stocks right there.
So, people want the reward but don’t want to “risk it to get the biscuit”.
Lots of people also want to go a step further and “beat the market”.
They’re even LESS prepared for the realities of how long underperformance can last.
What stretch of underperformance by a portfolio manager would you be willing to tolerate before selling the allocation?
— Meb Faber (@MebFaber) February 5, 2020
These responses are so telling. Many portfolio managers can go years, or even longer underperforming their benchmark and still be viable allocations.
Let me give you an example everyone can relate to.
An investor who put $10,000 into Berkshire Hathaway in 1965 would now have $200,000,000.
That’s Two. Hundred. Million. Dollars.
…(Compared to a still respectable $1.75mm for broad stock market.)
But most could never have endured the roller coaster to get there. It’s easy to fantasize about the $200,000,000 finish line…but think about suffering through one of Berkshire’s multiple 50% drawdowns…
Right now, revisit some past chapter of your life – say, saving for that down payment, or opening your kid’s enormous college tuition bill, or needing a new roof after finally getting that leak checked. You go to check your finances for the first time in a while, only to realize you’re down 50% because Berkshire has been tanking.
Would you have held, having no idea whether the losses would continue coming or not? Yet knowing that the down payment, or tuition, or roof had to be paid?
Active managers can have large drawdowns, but it is even harder to sit through periods of underperformance vs. the broad stock market index like the S&P 500. Underperforming your neighbor is the hardest behavioral bias to overcome.
“I’ve heard Warren say a half a dozen times, ‘It’s not greed that drives the world, but envy,’” Charlie Munger.
Buffett and friends stock picks, and similarly Berkshire’s stock, have gone loonnnnggg periods underperforming the broad US stock market. How long could you handle that? Most say less than three years. Given his record maybe Uncle Warren gets more of a pass so lets go crazy and assume you could handle five years.
How would you react if I told you his stock picks have underperformed for the past 17 years? What if I said he underperformed 11 out of those 17?
Yet, had you invested in Berkshire at the turn of the century, his picks would have outperformed the S&P 500 by three percentage points PER YEAR. (Top 10 stock holdings, equal weighted and rebalanced quarterly, via AlphaClone.)
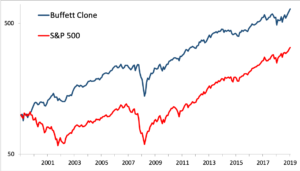
In fact, his performance would have beaten over 94% of all mutual funds during that period. (And the best part is he didn’t even charge you any management fees.)
That’s what it takes to outperform over time. Long ass periods of suck. (Technical phrase.)
Can you handle it? Most say they can’t. So, maybe the solution is you should just buy the S&P 500.
But, recall, most also said they can’t handle stocks underperforming bonds either.
This is why, despite being quite a simple endeavor (save, invest, and leave it alone) many people consistently fail at investing. Most will never leave their funds alone to achieve the magical 10x. Forget 100x.
So, what should your expectations be? Are they reasonable based on history?
These are mine, based on the path of investments over the past 120 years…:
Return expectations for investments over time, after inflation:
Stocks: 5%
Bonds: 2%
Bills: 1%
Real drawdowns for all of the above: 50%, worst case 90%.
A nicely constructed allocation: 4% per annum. Real drawdown 30%. Worst case 50%. (Here’s GMO on how long allocations can go with no real return, and you can also find historical asset allocation simulations in my free GAA book.)
Length of time any investment could have zero return or underperform a benchmark and still be viable: 20 years. (Worst case was 68 but most will never make it past 20.)
So, for those of you clicking on those internet ads promising 20% a year? Those ads promising outperformance EVERY year?
Good luck, you’ll need it.
PS For those interested in how I personally go about constructing my portfolio allocation, stay tuned in the coming weeks for a blog post update on how I manage my own money.
