The below is a summary of a 104(!) tweetstorm I did on twitter the other day…people complained it was hard to read through their monocle glasses so I recreated it here…enjoy!
—-
Here are my 6 favorite research pieces of 2019 making the case for global investing…
First up, @CreditSuisse with their “Global Investment Returns Yearbook 2019”
This is the yearly update to my favorite investing book, Triumph of the Optimists, and you can download every yearly update for free here. The report summarizes the long-run returns on stocks, bonds, bills, inflation and currencies in 26 global markets over the last 119 years.
We also did a podcast with author Professor Elroy Dimson here:
Episode #100: “High Valuations Don’t Necessarily Mean That We’re Going to See Asset Prices Collapse”.
Highlights (I edited down the quotes and they may skip around a bit…see piece for full transcript):
“Put in the context of the 119 years of history in the Yearbook and an equity risk premium over the period of just over 4%, it underlines how rewarding – and anomalous – the most recent past has been for equity investors….A more tempered view is a natural consequence of what by historical standards remains a world of low real interest rates…the long-run history of real interest rates in 23 countries since 1900, when real rates are low, future returns on equities and bonds tend to be lower.”
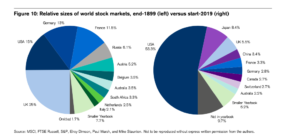
Here is a chart of the size of global stock markets in 1900 and today. Note, UK was
the biggest at 25% (5% now), and US went from 15% to 54%!
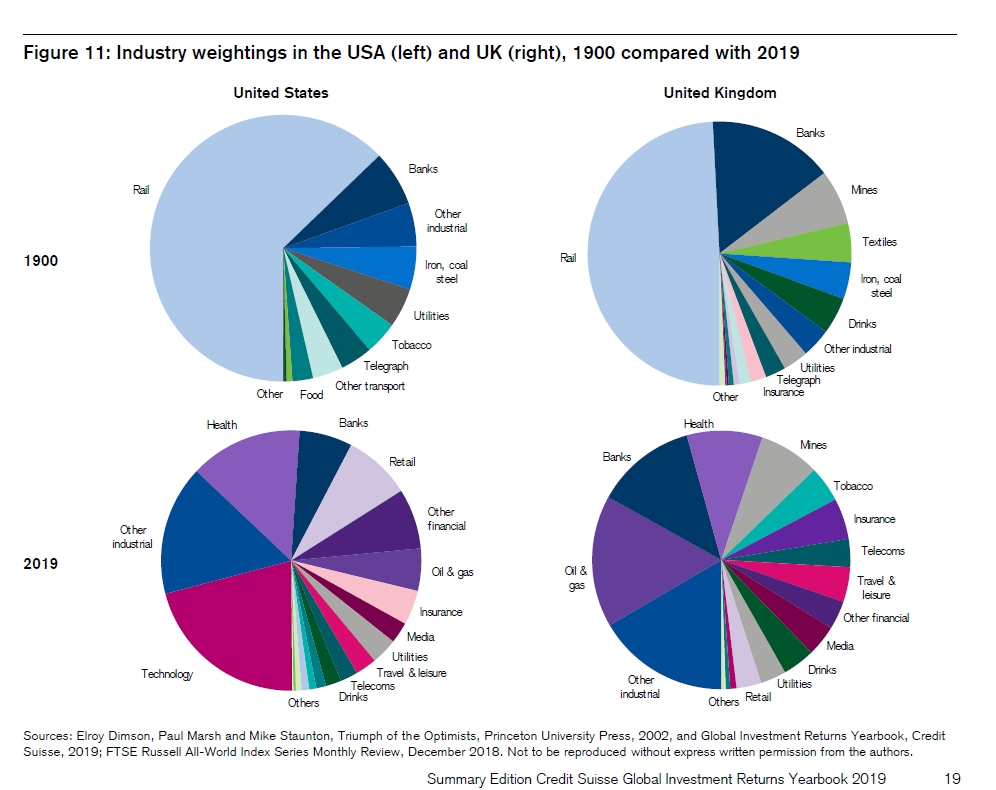
“Austria-Hungary was not a total investment disaster, it was the worst-performing equity market and the second worst-performing bond market of our 21 countries with continuous investment histories….Of the US firms listed in 1900, over 80% of their value was in industries that are today small or extinct….Even industries that initially seem similar have often altered radically. Compare telegraphy in 1900 with smartphones in 2019. Both were hightech at the time…Similarly, within industrials, the 1900 list of companies includes the world’s then largest candle maker and the world’s largest manufacturer of matches.”
“In the 2015 Yearbook, we asked whether investors should focus on new industries – the emerging industries – and shun the old, declining sectors. We showed that both new and old industries can reward as well as disappoint…….It depends on whether stock prices correctly embed expectations. For example, we noted that, in stock market terms, railroads were the ultimate declining industry in the USA in the period since 1900. Yet, over the last 119 years, railroad stocks beat the US market…Investors may have placed too high an initial value on new technologies, overvaluing the new, and undervaluing the old. We showed that an industry value rotation strategy helped lean against this tendency, and had generated superior returns.”
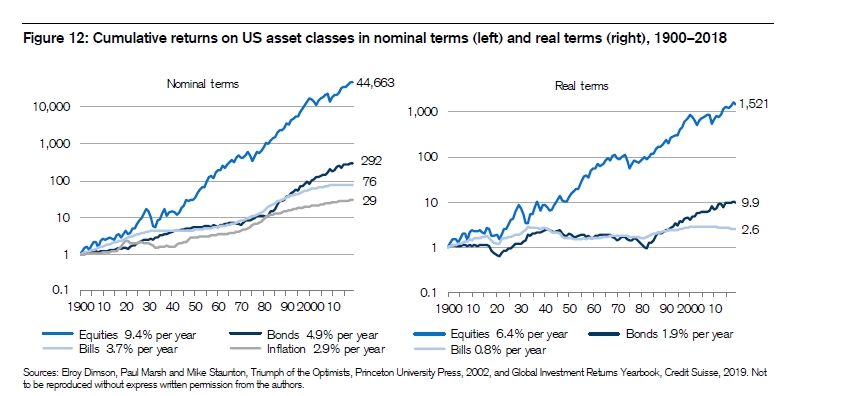
“US equities returned 9.4% per year, versus 4.9% on bonds, 3.7% on bills, and inflation of 2.9% per year. We should be cautious about generalizing from the USA, which, over the 20th century, rapidly emerged as the world’s foremost political, military, and economic power…By focusing on the world’s most successful economy, investors could gain a misleading impression of equity returns elsewhere, or of future equity returns for the USA itself. For a more complete view, we also need to look at investment returns in other countries.”
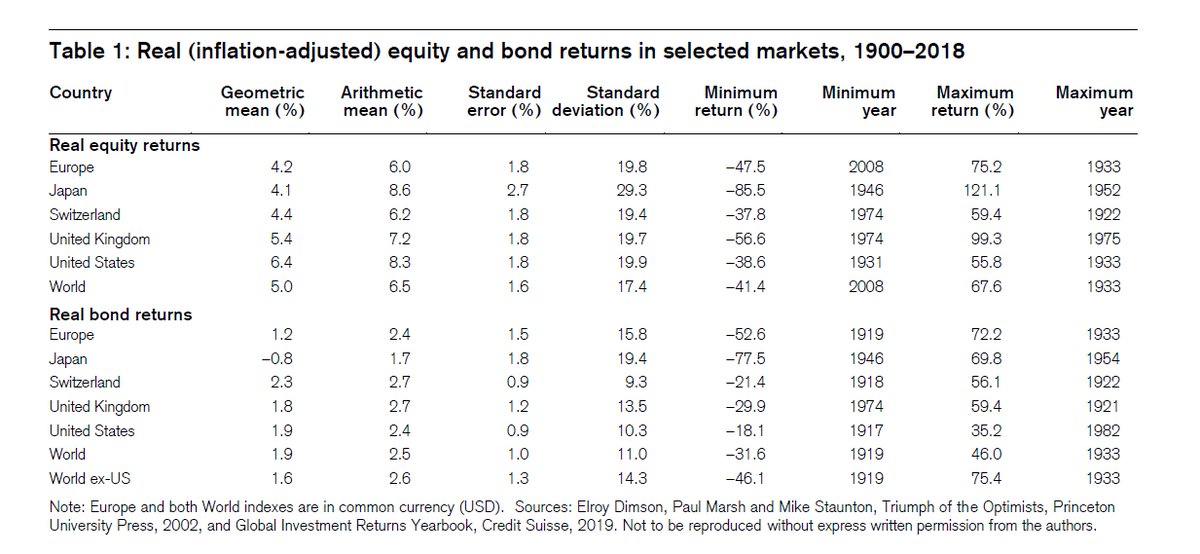
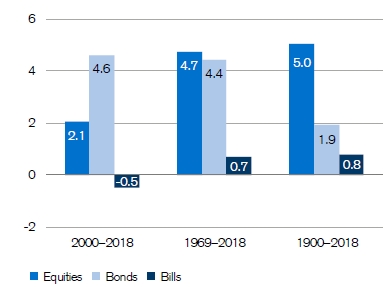
Here’s a chart of various countries and World. Note average real return after
inflation for stocks is 5%, and bonds 1.9%.
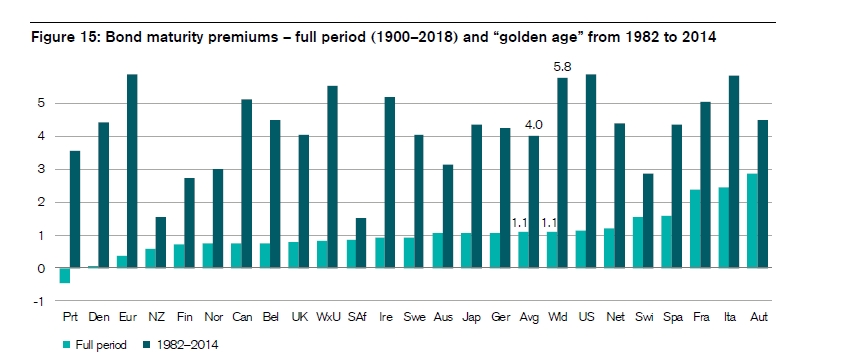
“Yield curve has historically on average been upward sloping; that is, long bonds
have typically offered a higher yield to redemption than shorter dated bonds &
bills. Extrapolating recent remarkably high bond returns & maturity premiums into
the future would be fantasy.”
Couple fun Japan stats:
-Futures have a long history in financial markets and, by 1730, Osaka started trading
rice futures.
-From 1900-1939, Japan was the world’s second-best equity performer. But World
War II was disastrous and Japanese stocks lost 96% of their real value.
-Tokyo Stock Exchange, founded in 1878
– By the start of the 1990s, the Japanese equity market was the largest in the world,
with a 41% weighting in the world index compared to 30% for the USA.
-1993 article in the Journal of Economic Perspectives reported that, in late 1991, the land under the Emperor’s Palace in Tokyo was worth about the same as all the land in California.
-Then the bubble burst. From 1990 to the start of 2019, Japan was the worst-performing stock market. At the start of 2019, its capital value is still close to one-third of its value at the beginning of the 1990s. Its weighting in the world index fell from 41% to 9%.
For global returns, I always say to use the 5:2:1 rule for expected returns on stocks, bonds, and bills over time (after inflation)…that’s the historical return of the World indexes…This includes “Two markets register a total loss – Russia in 1917 and China in
1949. These countries then re-enter the world indexes after their markets reopened in
the 1990s.
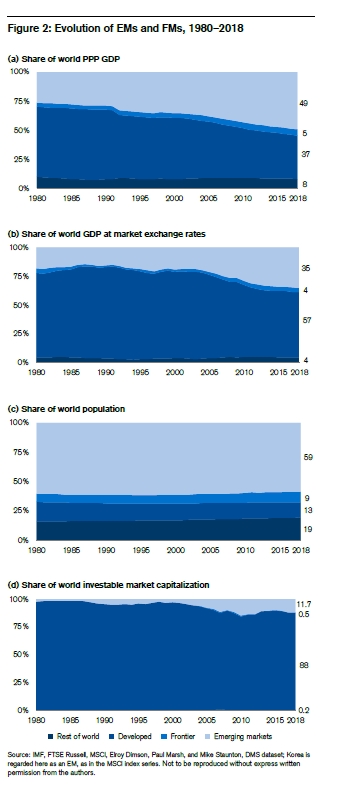
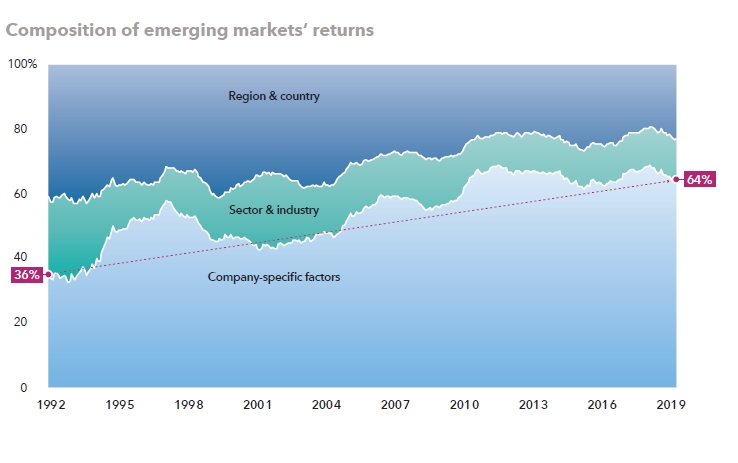
They then turn attention to emerging markets…which have most of world GDP,
population, but a fraction of market capitalization…
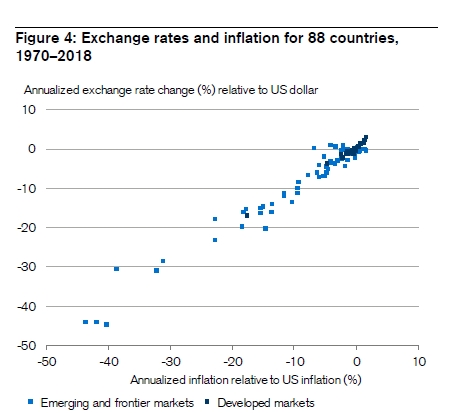
Regarding FX (and I don’t think people understand this):
“changes in countries’ exchange rates vs.the US dollar have been approx equal to inflation differential w/ the US over the same period…relative purchasing power parity has held to a reasonable approximation.”
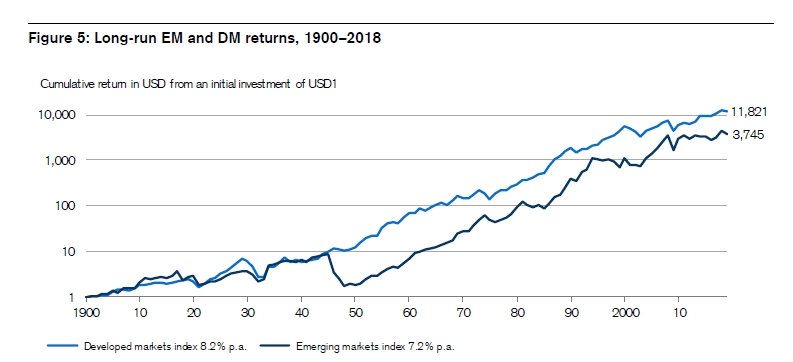
Then comments on emerging market performance:
“In the early part of the 20th century, emerging markets outperformed, but were hit badly by the October 1917 Revolution in Russia, when investors in Russian stocks lost everything. During the global bull market of the 1920s, emerging markets underperformed, but they were affected less badly than developed markets by the Wall Street Crash.
From the mid 1930s until the mid-1940s, EM equities moved in line with DM equities. From 1945–49, emerging markets collapsed. The largest contributor was Japan, where equities lost 98%….Another contributor was China, where markets were closed in 1949 following the communist victory, and where investors effectively lost everything. Other markets such as Spain and South Africa also performed poorly in the immediate aftermath of World War II.
From 1950 to 2018, they achieved an annualized return of 11.7% versus 10.5% from DMs. This was insufficient, however, to make up for their precipitous decline in the 1940s.
The annualized return from a 119-year investment in EMs was 7.2% compared with 8.2% from DMs, and 8.1% from our overall World index.”
My summary:
1. Historically, stocks, bonds, and bills have returned 5%, 2%, 1% after inflation.
2. Counties, assets, & sectors can and have essentially gone to zero. Extrapolating the experience of any one into the future is dangerous…diversifying your bets is a prudent idea.
Next up, we have @Vanguard_Group with “Global equity investing: “The benefits of diversification and sizing your allocation”
“As of September 30, 2018, U.S. equities accounted for 55.1% of the global equity market and non-U.S. equities accounted for the remainder.”
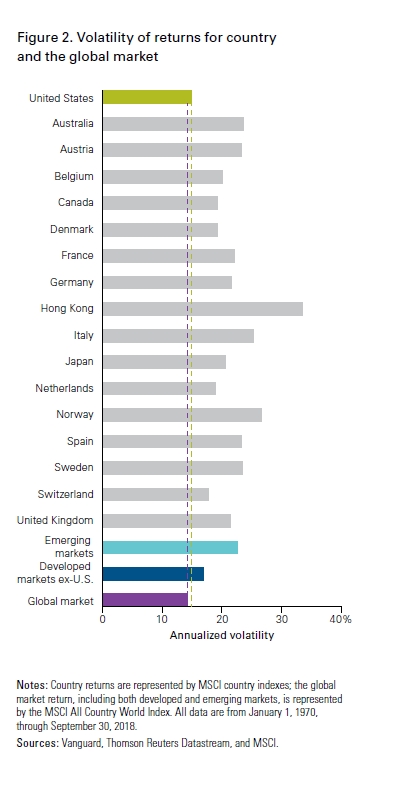
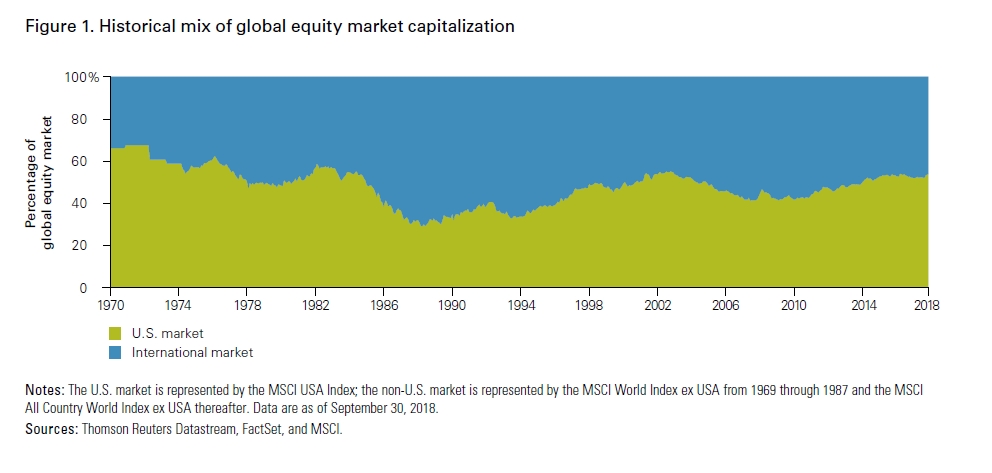 “While the US is the largest developed market, its size relative to the entire global equity market has fluctuated over time and was as low as 29% in the 1980s…….A portfolio invested solely within an investor’s home market, regardless of domicile, excludes a large portion of the global opportunity set…the benefit of global diversification can be shown by comparing the volatility of a global index with that of indexes focused on individual countries. While the US had the lowest volatility of any individual country, its volatility was slightly higher than that of the global market index. Other countries examined had volatilities that were 15% -100% greater than the global market index.”
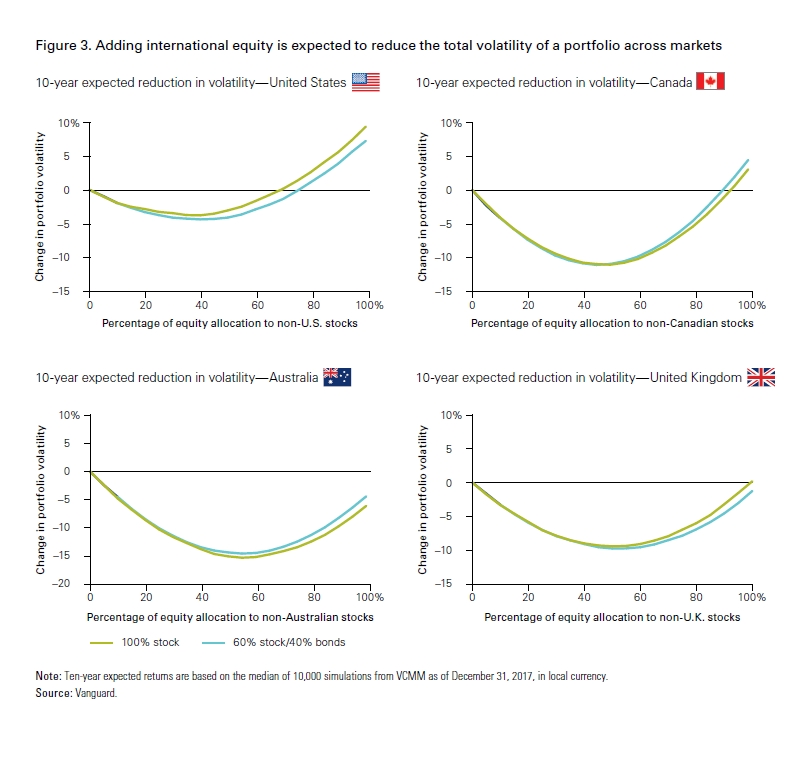
“Scott et al. (2017) found that, in practice, most investors in these markets exhibit a strong home bias and overweight domestic equities relative to their global market capitalization weight….A combination of imperfectly correlated returns across
countries and lower global market volatility means that investors in each market examined will likely realize diversification benefits from incremental allocations to international stocks.”
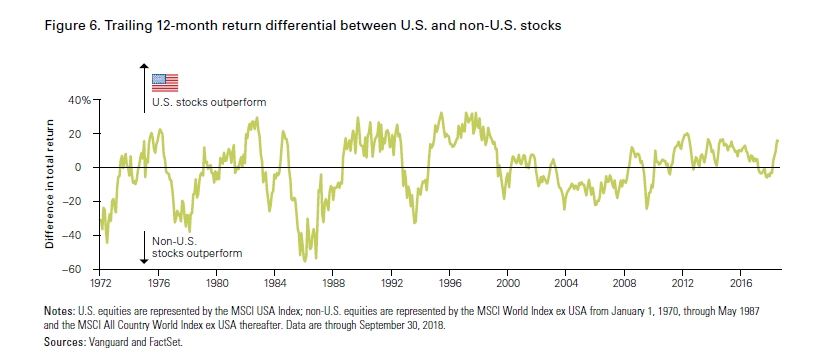
“Another benefit of global diversification is the opportunity to participate in whichever regional market is outperforming. This is a critical component of diversification that correlation does not effectively capture. For example, while the United States may lead over some periods, another country or region will invariably lead at other points.”
“Domestic investors should consider allocating part of their portfolios to
international equities. In determining how much to allocate between domestic and international equities, a helpful starting point for investors is global market capitalization weight.”
My summary:
1. Again, diversify globally. Adding international stocks reduces volatility and averages
outcomes.
2. A starting point for US investors is the global weight of 50% in US and 50%
international. (Vanguard currently recs 40% international. Bogle before passing, zero!)
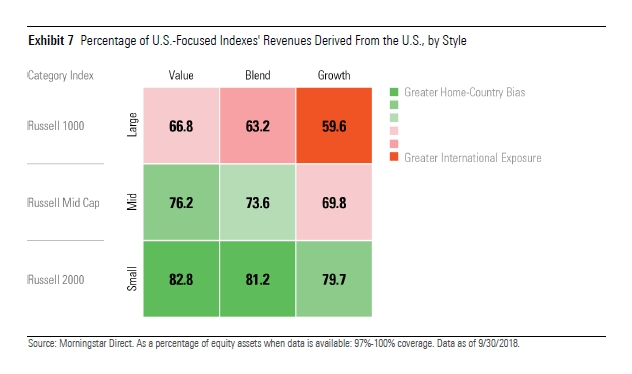
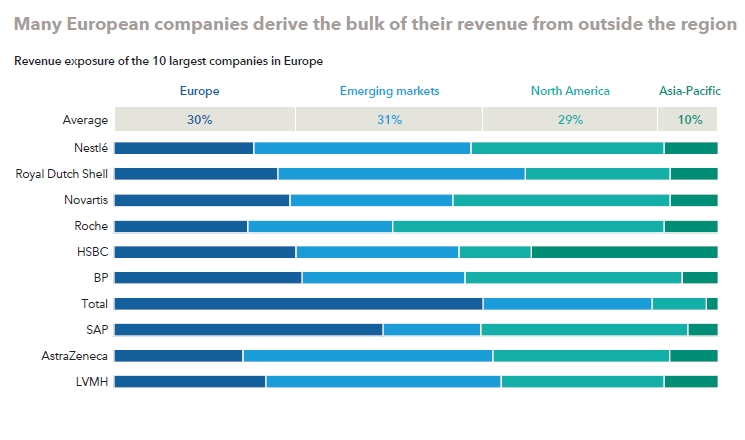
Next up, @MStarResearch with “A New Perspective on Geographical Diversification Revenue Exposure by Region”
“Domicile has long been an investor’s only way of geographically diversifying a portfolio. In certain instances, this can give a misleading interpretation of the actual diversity of a portfolio. As the world has grown, so has the reach of large multinational companies. “
“Now, where a company is headquartered can have little bearing on where its underlying revenues come from. The tobacco company Philip Morris International PM, for example, has long been one of the largest stocks in the S&P 500 Index without ever having any U.S. revenues. Similarly, the pharmaceuticals firm GlaxoSmithKline GSK is a large fixture in Britain’s FTSE 100 Index but gets minimal revenue from the United Kingdom.”
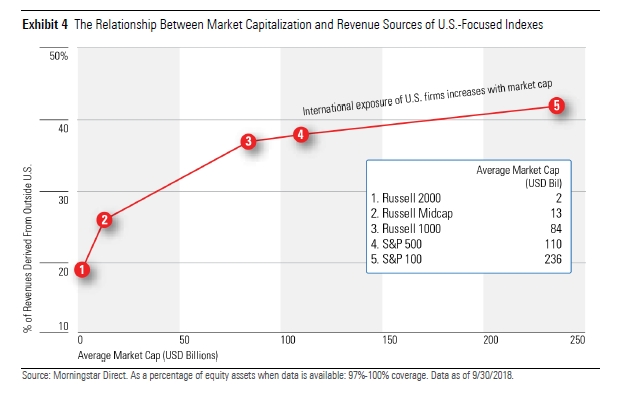
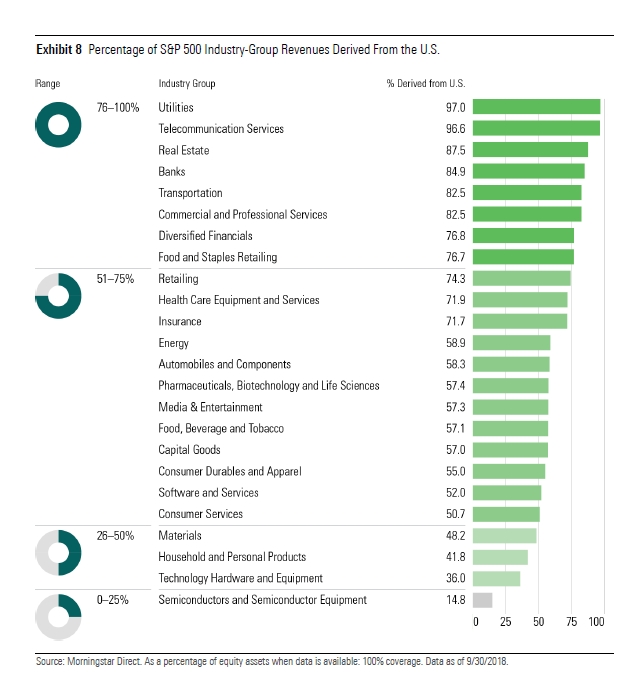
“Morningstar’s Revenue Exposure by Region capability allows investors to better understand the global makeup of their equity portfolios. Geographical revenue diversification isn’t evenly distributed throughout sectors with utilities, real estate, and financials tending to be the most provincial and technology and materials the most multinational. Revenues generally become more domestic as one moves down the market cap ladder and toward value-oriented market segments; they become more global as one moves up the market-cap ladder and toward growth-oriented market segments.”
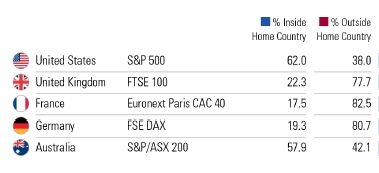
“…home-country bias is especially pronounced for U.S. investors. Only Australia’s S&P/ASX 200 Index rivals the United States’ S&P 500 Index for the percentage of revenue it receives from its home country, 57.9% versus 62%…At the other end of the spectrum, France’s Euronext Paris CAC 40 Index garners just 17.5% of revenue from its home country. The MSCI All-Country World Ex-U.S. Index receives 16.8% of its revenue from the US, even though the benchmark excludes U.S.-domiciled companies!”
“…Those industry groups with the lowest U.S. revenue percentage tend to have a
heavier weighting in growth-oriented benchmarks and funds, while those with the
highest U.S. revenue percentage tend to have a heavier weighting in value-oriented
benchmarks and funds.”
“…maps the growth and value versions of the Russell 1000, Russell Midcap, and Russell 2000 indexes to the nine grids of the Morningstar Style Box, including the percentage of each benchmark’s U.S. revenue.”
My summary:
Borders and sectors are becoming increasingly meaningless. Anytime you move away
from the global market portfolio to a segment like a region, country, or sector you are
going to introduce bias & tilts to your portfolio (for better or worse). For maximum breadth, investors should focus on the entire world. However, if you DO decide to segment your portfolio, at least be aware of the (un)intended effects…”
(PS others will interpret this piece differently. )
Piece number four! @capitalgroup with “Guide to International Investing: How to Go Global in an Uncertain World”
“If you feel like international equities in your portfolio aren’t holding up their end of the bargain, then you’re not alone. It’s one of the most common investment concerns we hear today.”
Over/underperformance goes through long cycles
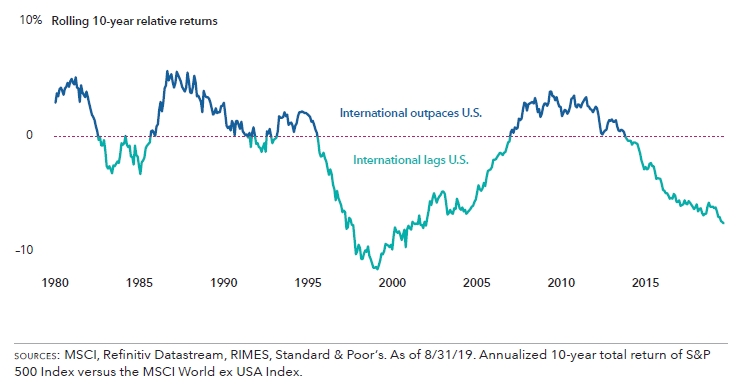
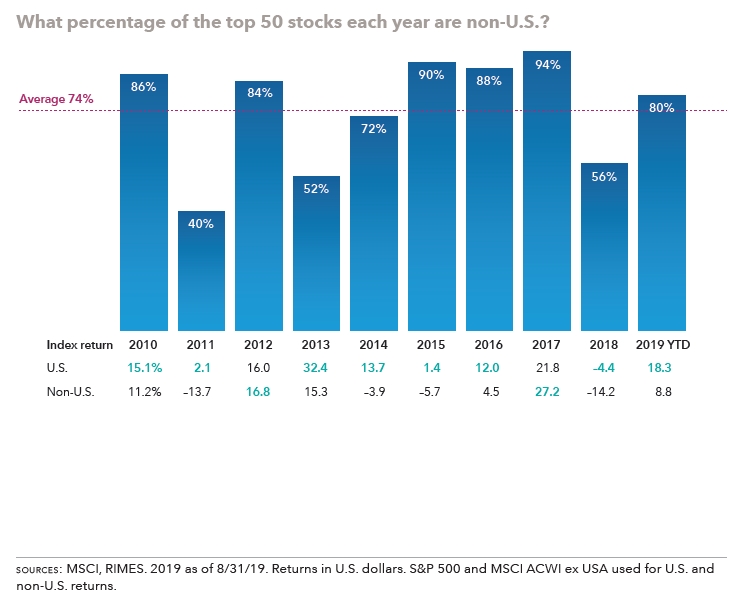
“International equities have trailed U.S. markets over the past 10 years, but the index-based returns that most investors follow don’t tell the whole story. On a company by company basis, the picture is quite different. In fact, it may come as a surprise that the companies with the best annual returns each year have been mostly based outside of the United States.”
Again, increasing breadth is a good thing!
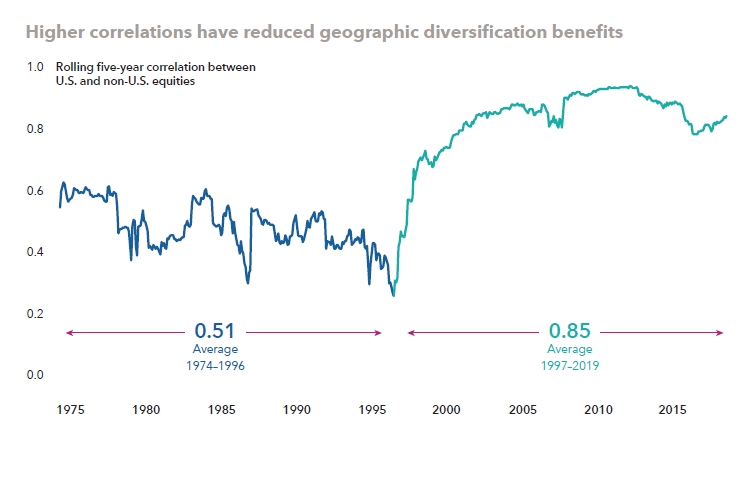
“As companies have become more global, the lines between U.S. and non-U.S. indexes have started to blur, and correlations between the two have risen.”
Makes sense, see Morningstar thread….that’s just globalization…(some may
blame central banks)
“If real estate is all about “location, location, location,” investing may be all about “revenue, revenue, revenue.” As the shift toward globalization continues, the address of a company’s HQ has become less important to its growth prospects than where it makes money.”
“The bottom line? Follow the money, not the mail.”
People love lumping companies into countries, sectors, and regions, etc…which all have an influence. But main driver is still company specific fundamentals.
“There are many reasons for lackluster non-U.S. returns over the last decade: a strong U.S. dollar, political turmoil and trade tariffs — just to name a few. But another factor is the way in which we typically measure international markets.”
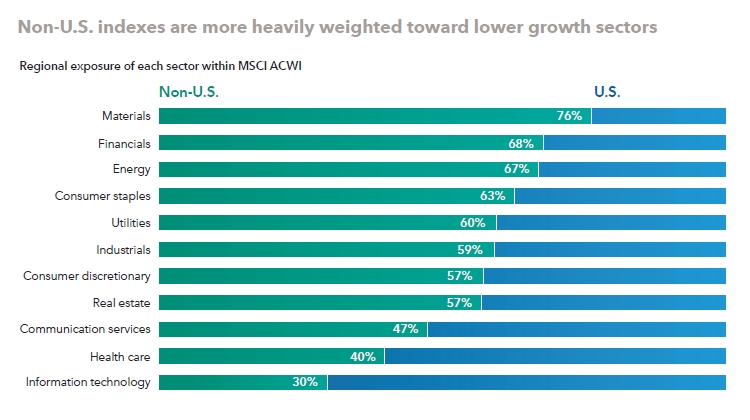
“International indexes generally have a greater concentration of value-oriented stocks in “old economy” sectors such as materials, financials and energy. Contrast that with the U.S., where technology, health care and consumer tech dominate the S&P’s 500 Composite Index.”
“If you were going fishing, would you limit yourself to half the lake, or would you want to seek opportunities wherever they were available? Investing shouldn’t be any different.”

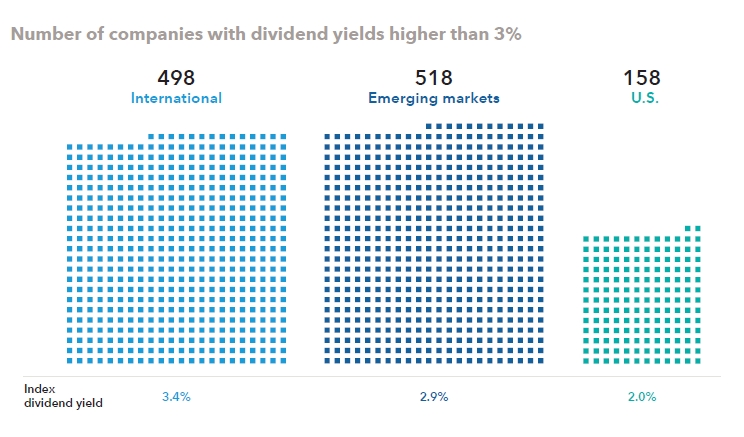
“Outside the U.S., more companies have tended to pay dividends and have done so at higher levels. There were more than six times as many non-U.S. stocks with yields over 3%, as of August 31, 2019.”
“Valuations matter. There is evidence that stocks trading at a discount average higher long term returns in future periods than those selling at a premium. But the key phrase here is long term, because there is almost no correlation between valuations and short-term returns.”
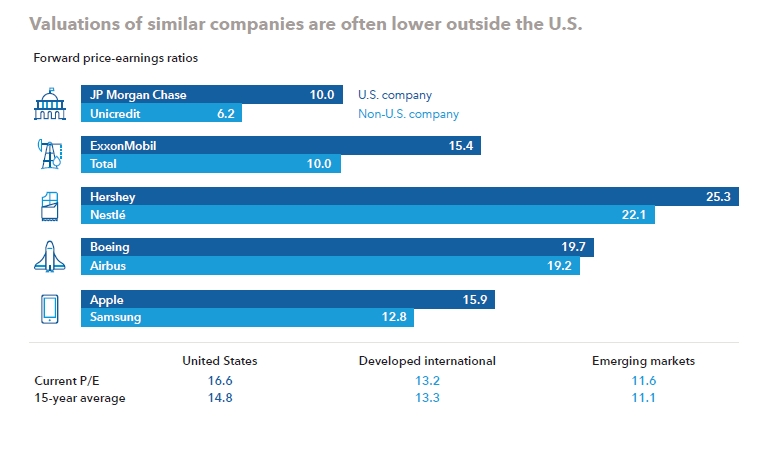
“When it comes to answering the question,“How much international equity do you need?” the simple answer may be,“More.”Whether it’s due to a home bias or a lack of rebalancing during the long U.S. bull market,many investors may find themselves underexposed to non-U.S. equities.”
My summary:
1. International has underperformed over the past decade, but that goes through cycles.
2. Bargain hunters should consider focusing on companies all over the world due to breadth, higher income, and lower valuations.
Number 5! @Bridgewater with “Geographic Diversification Can Be a Lifesaver, Yet Most Portfolios Are Highly Geographically Concentrated”
This piece rhymes a lot with the @creditsuisse one..
“The best way we know to earn consistent returns and preserve wealth is to build portfolios that are as resilient as possible to the range of ways the world could unfold. To uncover vulnerabilities that are outside of investors’ recent lived experiences, we find it valuable to stress test portfolios across the various environments that have cropped up across countries throughout history. One common vulnerability is geographic concentration.”
“In the past century, there have been many times when investors concentrated in one country saw their wealth wiped out by geopolitical upheavals, debt crises, monetary reforms, or the bursting of bubbles, while markets in other countries remained resilient.”
“Rather than try to predict who the winner will be in any particular period, a geographically diversified portfolio creates a more consistent return stream that tends to do almost as well as whatever the best single country turns out to be at any point in time.”
“So geographic diversification has big upside and little downside for investors. Geographic diversification felt less urgent during the recent decade of great returns for most assets and portfolios. Low asset yields going forward make diversification and efficient risk-taking all the more important to investors.”
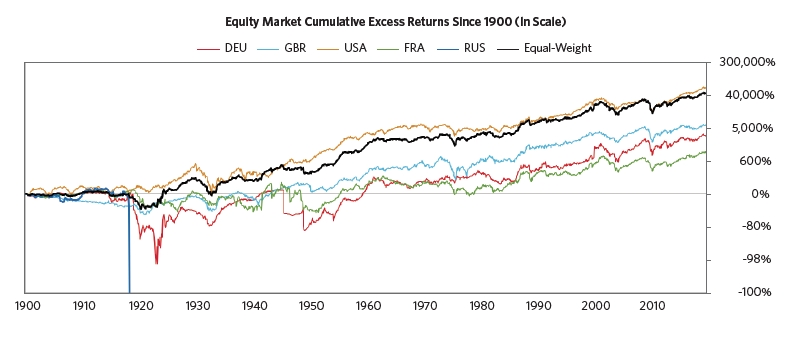
“The chart below shows cumulative returns above cash back to 1900 for the equity markets where we have reliable data going back over 100 years. An investor concentrated in Russia or Germany in the early 20th century would have lost most or all of their wealth, while an equally weighted mix of the five countries shown below does almost as well as the best performer.”
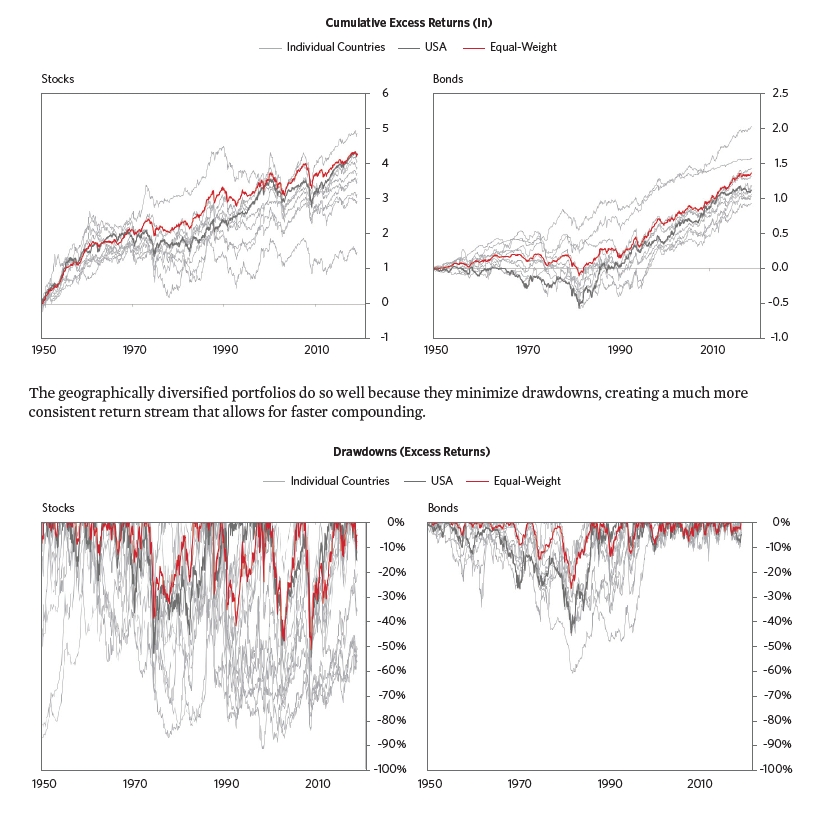
“Looking at a broader set of stock and bond markets back to 1950, you can see that an equally weighted mix has consistently performed well.
“The table below looks decade by decade at how equity performance across countries stacks up.”

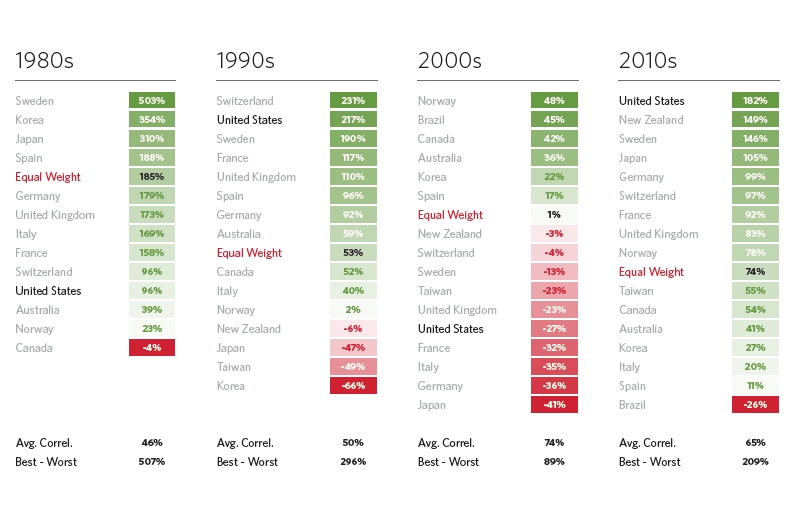
“This decade, the US has been the best performer so far, but it was one of the weaker performers in the previous decade following the dotcom bust; it was one of the best performers in the 1990s…but before that you have to look back to the 1920s to find a decade in which US equity performance was better than middling. There are plenty of instances in which geographic diversification has been a lifesaver, preventing wealth from being wiped out. Below, we show a few perspectives on this. For each country, we looked at its deepest drawdown and how long it took to recoup the losses.”
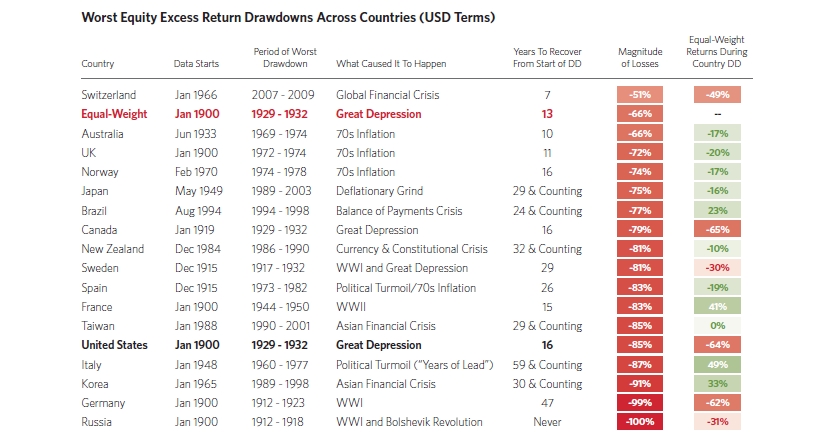
“There are plenty of instances where a given country’s equity market was decimated, and it often takes decades to recover from the losses.”
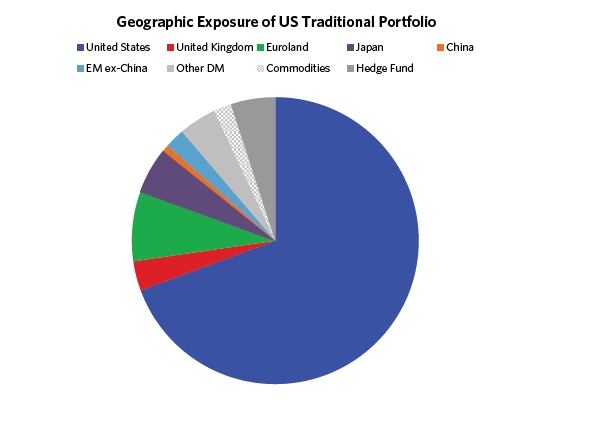
“Developed world investors are similarly under allocated to the rest of the emerging world and tend to have a large home country bias, leaving them geographically concentrated overall. Below, we show an example of a typical US investor portfolio’s geographic exposure.”
My summary:
1. A simple diversified equal weight can achieve nice returns with low volatility and help
avoid going bust.
2. The US stock market has underperformed equal weighting in 8 of 12 decades. (Let that sink in if you plan on extrapolating recent outperformance….)
Last paper, Rob Arnott of @RA_Insights with “Are Valuations Now Irrelevant?”
(Note: This is from a PPT so some of the text will be headlines in CAPS)
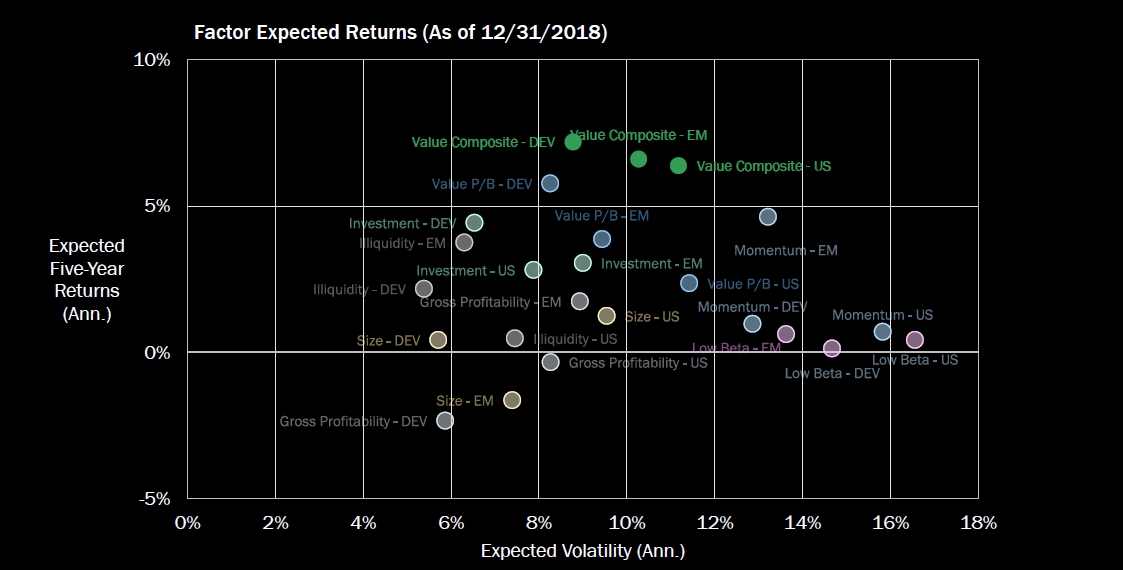
“Current Equity Factor Return Forecasts: The Highest Return Potential Is Available from the Value Factor”
PS that is from their allocation module here:
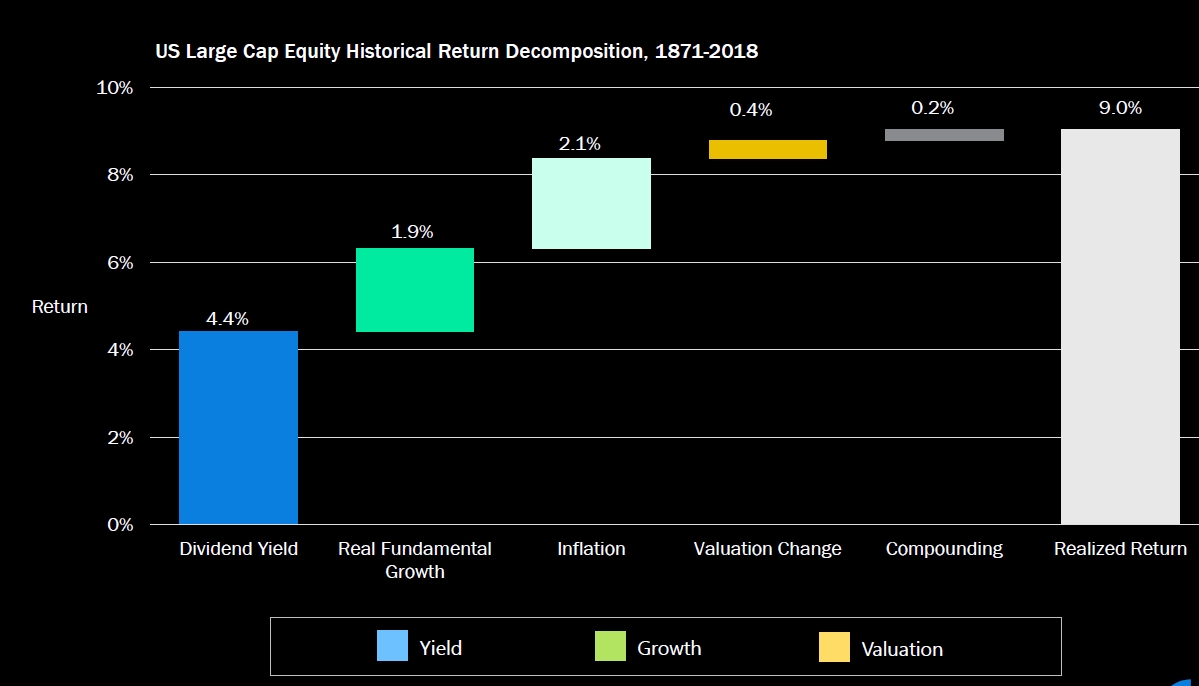
“What Were the Sources of Historical Returns?” ie the Bogle formula
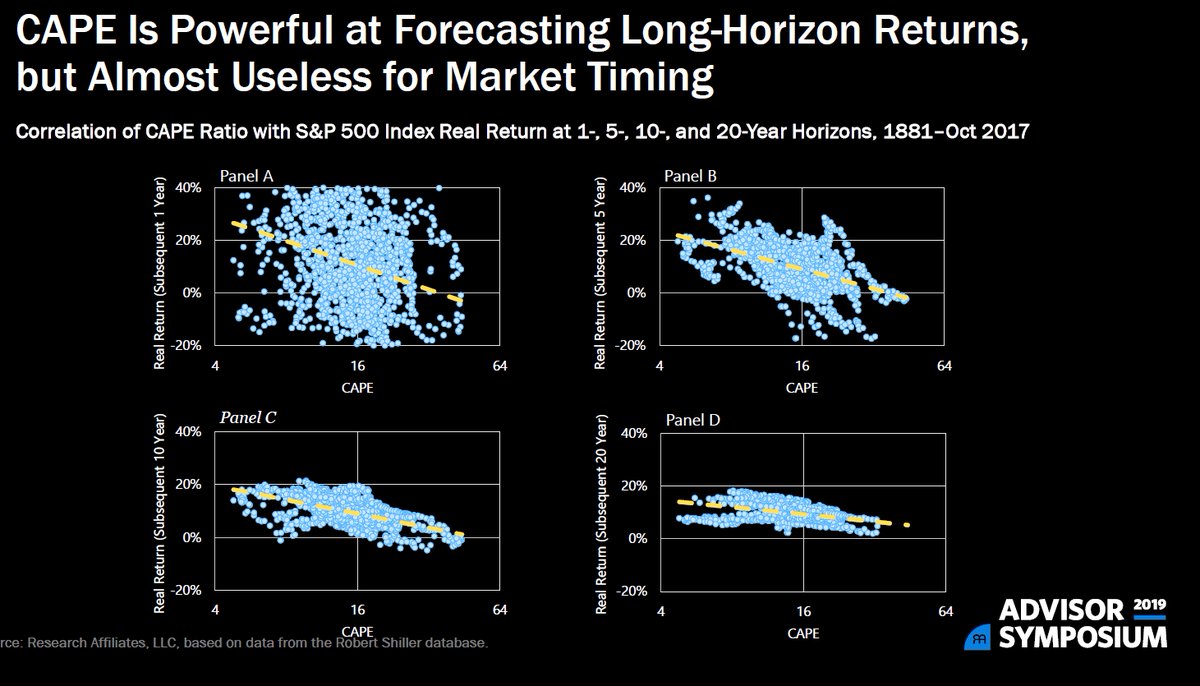
“CAPE Is Powerful at Forecasting Long-Horizon Returns,but Almost Useless for Market Timing Correlation of CAPE Ratio with S&P 500 Index Real Return at 1-, 5-, 10-, and 20-Year Horizons, 1881–Oct 2017”
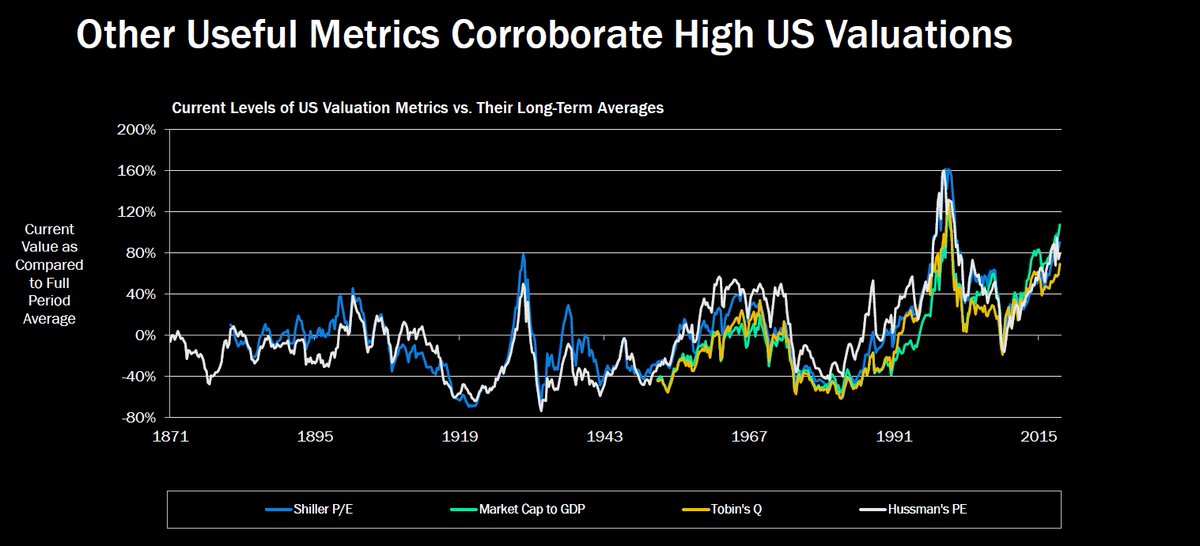
“Other Useful Metrics Corroborate High US Valuations”
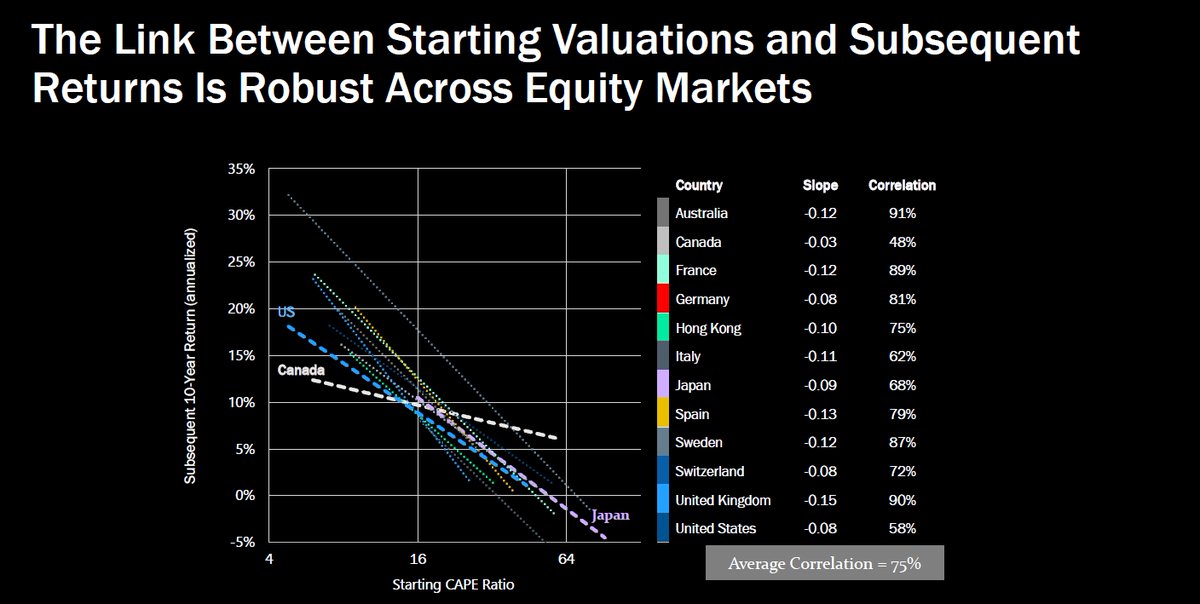
“The Link Between Starting Valuations and Subsequent Returns Is Robust Across Equity Markets”
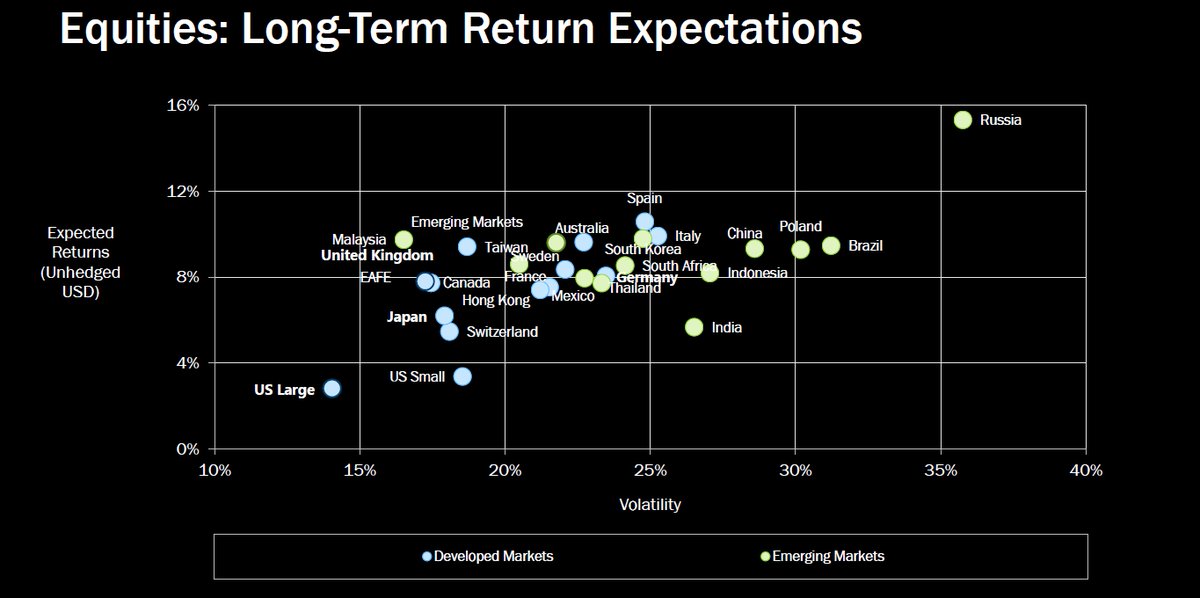
“Equities: Long-Term Return Expectations”
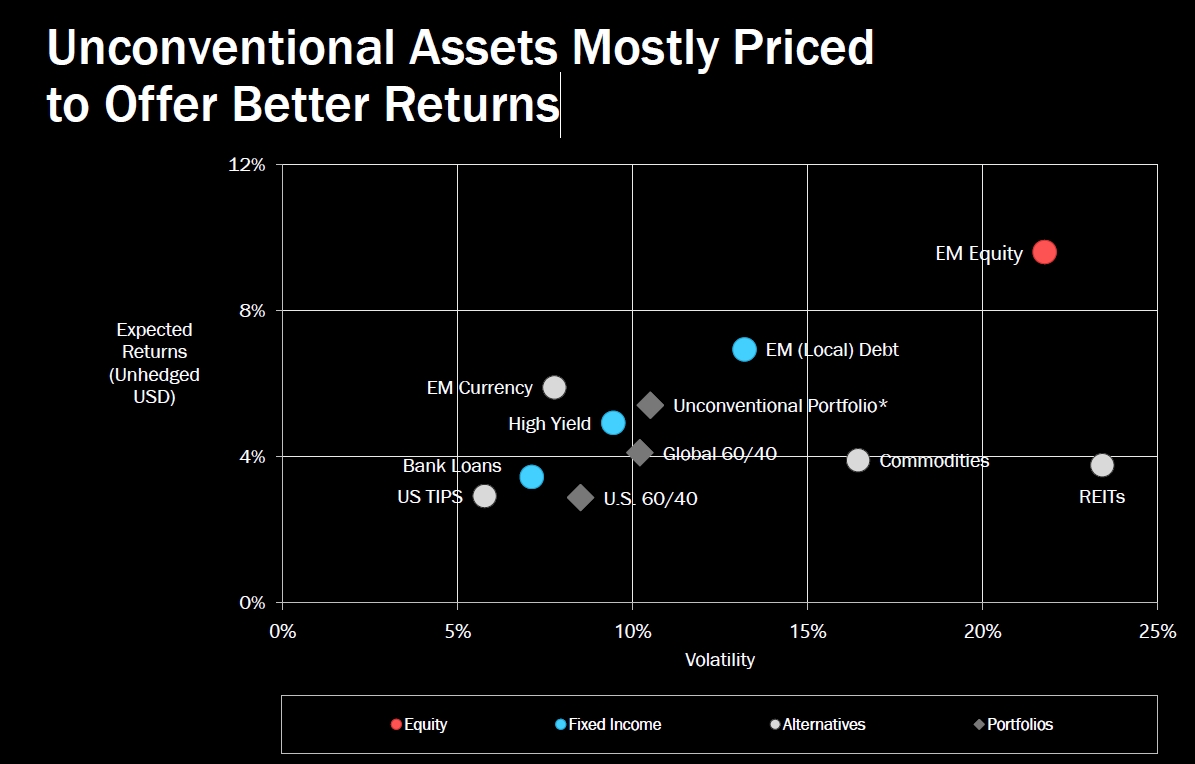
“Unconventional Assets Mostly Priced to Offer Better Returns”
“The link between starting valuations and subsequent returns is powerful
•Valuation levels are not useful for timing market tops and bottoms.
•Chasing returns can be very costly.High valuations can go higher, but not
indefinitely.
“•“Over-rebalance” into laggards —averaging in —as a long-term performanceenhancing strategy.
“Across asset classes, higher return potential exists in international and diversifying markets Within equities, the value factor offers the highest return potential today”
“The largest stocks in the market are often expensive and have historically underperformed after reaching the top 10”
Didn’t really touch on this but more in the PPT. Also, there’s also a flaw with market cap weighting in that there is no tether to fundamentals.
@RA_Insights has some great research on the topic where they show investing in the largest stock in each market or sector goes on to underperform by 3 percentage points per year for a decade!
Episode #18: Rob Arnott, “People Need to Ratchet Down Their Return Expectations”
It’s just capitalism and its creative destruction and it’s the way it should be. Nice chart from @NDR_Research that compares the S&P 500 to investing in the largest stock in the market at the time. It’s a laundry list of the top American companies like @walmart, @google..
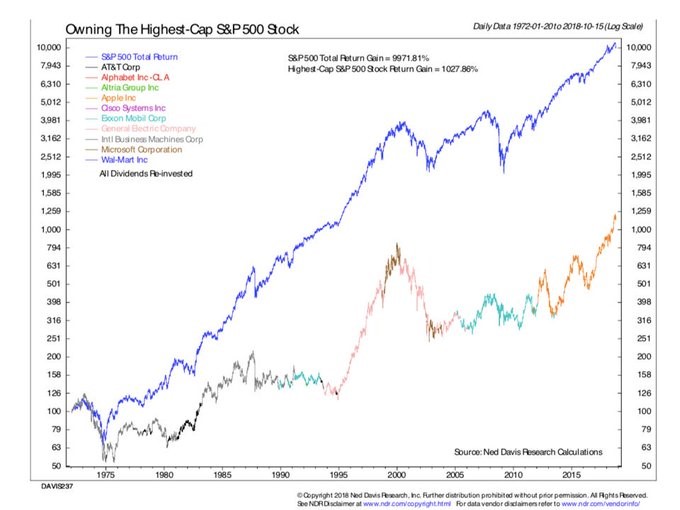
And it’s a HORRIBLE idea.
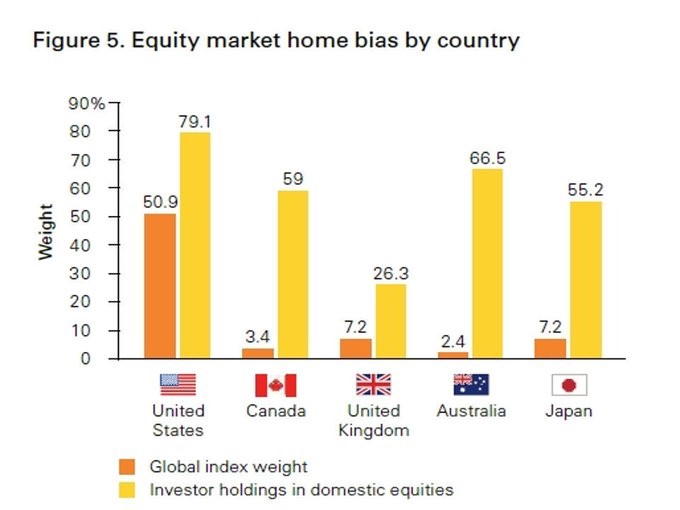
Ok, so we’ve hit 100 tweets so lets summarize…despite all the evidence above most people will continue to massively concentrate in their own market. That “home country bias” is a really bad idea and easily avoidable…chart via @Vanguard_Group
My summary:
1. Diversifying globally can save your butt
2. Investors should start with global market allocation (50% US / 50% Foreign) for full opportunity set and breadth
3. Consider adding value tilts (This is uncomfortable for some)
4. Relax and sleep tight
That’s it! For those that wanna dive in more, most of my books are free to download here.
and you can listen to my monotone on the pod here.
My top Global Stock Valuation resources (including downloadable CAPE ratios):
1. The Idea Farm
2. Star Capital
3. Research Affiliates
4. Barclay’s
5. Shiller
6. French Fama
7. Aswath Damodaran
8. Global Financial Data
Have a great weekend!
