Cambria Fund Profile Series – Cambria Tail Risk ETF (TAIL)

![]()
![]()
![]()
![]()
![]()
Host: Meb Faber is Co-Founder and Chief Investment Officer of Cambria Investment Management. Meb has authored numerous books, whitepapers and blog posts, and is the host of The Meb Faber Show podcast.
Date Recorded: 5/26/2020 | Run-Time: 16:12
Comments or suggestions? Email us Feedback@TheMebFaberShow.com or call us to leave a voicemail at 323 834 9159
Interested in sponsoring an episode? Email Justin at jb@cambriainvestments.com
Summary: In today’s episode of the Cambria Fund Profile Series, Meb discusses the Cambria Tail Risk ETF (TAIL).
Meb walks through the S&P 500’s move from it’s all time high on February 14th 2020 to it’s recent low on March 23rd 2020 that resulted in a decline of 33.7% in just 20 days.
He poses the question: “Is there any way an investor might have been able to mitigate this decline in his or her portfolio?”
He then makes the case for the Cambria Tail Risk ETF (TAIL), a fund engineered to help guard against significant market drawdowns.
As the episode winds down, Meb poses this scenario:
“Is the stock market back on solid footing today? No one has a crystal ball. If I told you a year ago, that unemployment would jump from low single digits around 4% to over 15% today, that Fed interest rates would fall from 2.5% to near zero today, that gold would be up massively, stock volatility would be up, and oil would crash down over 50%, and yet, despite all of this, stocks are up. Would you believe me? Most would not.”
All this and more in this Cambria Fund Profile Series episode, featuring the Cambria Tail Risk ETF (TAIL).
Links from the Episode:
- 0:39 – Intro
- 1:44 – Cambria Tail Risk ETF
- 2:26 – For the first time in history, the US economy has started and ended a decade without a recession – CNBC
- 2:53 – The Dow plunged into a bear market in just 20 days – the fastest 20% drop in history – Markets Insider
- 3:22 – Mitigating stock market declines?
- 3:43 – Background on hedging risk
- 5:31 – Cambria Tail Risk ETF – Strategy overview
- 7:50 – Recent performance overview – Chart
- 10:35 – As of April 30th, 2020, TAIL has the lowest prospectus net expense ratio in the entire Morningstar Bear Market category, out of 59 funds.
- 11:52 – Disclosure
Transcript:
Welcome Message: Welcome to The Meb Faber show where the focus is on helping you grow and preserve your wealth. Join us as we discuss the craft of investing and uncover new and profitable ideas, all to help you grow wealthier and wiser. Better investing starts here.
Disclaimer: Meb Faber is the co-founder and chief investment officer at Cambria Investment Management. All opinions expressed by podcast participants are solely their own opinions and do not reflect the opinion of Cambria Investment Management or its affiliates.
Intro: Howdy podcast listeners, we have a little bit of a different show for you today. Over the past decade, we’ve made an effort to educate our clients and investors, now over 40,000 strong, by publishing research and commentaries across the blog, academic papers, books, speeches, and now in the more modern social world, Twitter, YouTube, and this podcast. However, we still get many great questions every day about our funds, many of which are broadly similar, so we wanted to try and use this platform to help educate shareholders as much as possible. You know, Sometimes the spoken word provides a little more context and narrative than just an academic paper or factsheet. And as always, the most important thing in investing is finding an approach that works for you, which may or may not involve any of our funds, which is totally fine. We just want our shareholders to be as informed as possible in what they’re invested in. So enough intro, please enjoy today’s episode in our series of fund profiles.
Meb: Welcome, podcast listeners. Today we have a special fund profiles episode in which I’m going to be talking about one of our own strategies and funds, the Cambria Tail Risk ETF, ticker symbol: TAIL. We’re going to discuss the stock market, specifically, the recent Coronavirus-related bear market, and then how investors can play defense against such declining markets.
So, let’s start with a pop quiz.
What was the longest U.S. economic expansion on record?
If you answered, “the one that just got bulldozed by the Coronavirus” you’re right.
As of the end of the decade, December 2019, the U.S. economy had expanded for a record 126 straight months. That was the longest period in the country’s history according to the National Bureau of Economic Research.
But let me phrase it in a different way in order to drive home the significance… The U.S. economy started and ended an entire decade without a recession. That’s never happened before.
As for the stock market itself, it enjoyed the longest-running bull market in history, with the S&P 500, which is an index representing large-cap stocks, climbing roughly 400% from March 2009 through February 2020.
But then our world changed and the investment markets were upended seemingly overnight by the virus.
It took just 20 days for the S&P 500 to fall from an all-time-high into a bear market, which is measured by a decline of at least 20% from the most recent peak. That’s the fastest decline into a bear market in the U.S. stock market in history.
Days later, stock markets hit their respective lows related to the Coronavirus – at least at the time of this recording. From its all-time-high on February 14, 2020 to its recent low on March 23rd, the S&P 500 fell about a third, 33.7%. Ouch.
Now, is there any way an investor might have been able to mitigate this decline in his or her portfolio?
As you’ll hear in a moment, we believe the answer is a resounding “yes,” courtesy of the Cambria Tail Risk ETF. That’s because we’ve engineered the fund with the goal of actually profiting from a falling market.
But before we get into those details, let me provide you with a little bit more background.
So think about hedging. What’s the right answer? And spoiler alert…the conclusion usually isn’t to panic and sell all your stocks, sell everything, and indeed hedging can actually take many different forms. If you’re a stock investor, first, you don’t have to put all your money in stocks. We often say the best way to hedge a risk is not to take the risk in the first place. And no one says anywhere you just gotta put all your money in stocks, 100% in equities. So things like cash and bonds are an acceptable alternative choice, so instead of maybe 100% in stocks, investors could own 80% or 60% or even less, with the remainder in cash and bonds. Second, you also don’t have to limit yourself to only US stocks. If you’ve heard me for a long time, we feel this choice is a no-brianer and we’ve spoken many times over the past few years about how moving into cheaper, foreign equities could be a wise choice in a world dominated by what we believe are more expensive US stocks. Additionally, diversification into foreign bonds, real assets like commodities and real estate historically, has done a good job of helping to lower overall portfolio volatility and drawdowns. It of course does not guarantee protection, but on balance, it has helped. Third, you could add things like liquid alts, and incorporating strategies like trend following, or managed futures, or long-short market neutral equity, could also help hedge your risks a bit. And most investors are familiar with these choices, but there’s a fourth one, which while too is defensive, if used tactically, it could be an offensive strategy. And to be clear, it’s not for everyone, and it’s probably not also for all the time. That said, when used wisely and strategically, it has the ability, not only to help hedge the portfolio during drawdowns, but positions the portfolio to potentially profit from it. So, we attempt to implement these ideas and concepts in the management of the Cambria Tail Risk ETF.
So TAIL, that’s the ticker for the Cambria Tail Risk ETF, is a reference to the statistical distribution curve, where extreme events tend to occur in either “tail”, both positive and negative. People don’t sweat the positive tail, of course, but in our case, we’re looking to help investors guard against those extreme market drawdowns that exist in the far left-side of the distribution’s tail.
TAIL does this through buying put options. If you’re less familiar with options, a put option is a contract that gives the owner the right to sell an underlying asset at a specified price within a specified period of time. A put option generally increases in value as the market price of the underlying asset falls.
For listeners with a little bit more options-understanding who are wondering about the specifics of the fund, TAIL seeks to buy a ladder of monthly put options on the S&P 500 that are slightly out-of-the-money. Defining these terms, a “ladder” of put options means a series of puts with varying, successive expiration dates, generally ranging from a few months to well over a year until expiration. We buy these put options continually and systematically, over rolling one-month periods. As to the term, “out of the money,” when it’s used to describe a put option, this references a strike price, which is the price at which the put option can be exercised, that is lower than the market price of the underlying asset.
So overall, we invest about 90% of the portfolio in 10-year U.S. government bonds with the remainder of the portfolio in our targeted ladder of puts.
One of the benefits of pairing put options with treasuries is the income stream generated from treasuries helps offset the cost of the put options. Now it’s a little bit less with where bond yields are today, versus the historical 4, 5, 6% yields, but it still helps.
So with that background behind us, let’s turn to TAIL’s performance.
Prior to the Coronavirus-related bear market, discussing TAIL’s ability to gain in value during times of market distress was more of a theoretical discussion. That’s ‘cus the market kept goin’ up. Although after, since TAIL’s launch, the broad stock market has continued its bull climb.
However, the recent bear market provides investors a real-world illustration of how it performs as the stock market falls. Best of all, it does so using an actual, out-of-sample environment, not just a historical backtest.
So when we built TAIL, our goal was for it to post gains that approximated the size of losses happening in the S&P during times of downward turbulence.
So, how did it do?
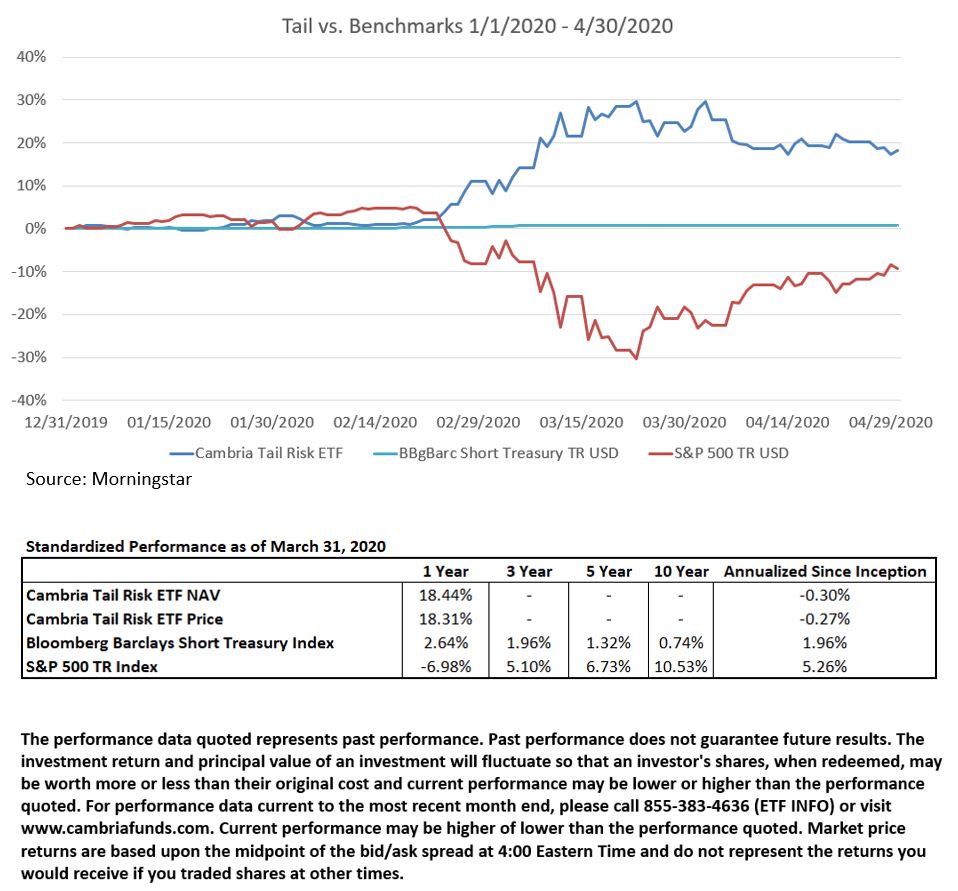
Well, we’ll post a chart showing its performance during the bear market in the show notes. But I’m about to reference this chart if you’d like to download it and follow along. But bear in mind as we walk through this, our discussion of returns is intended to provide a look at a short period of performance to offer a glimpse of how the fund performed. By no means can we guarantee similar future performance, and ongoing market events and circumstances can also lead to increased volatility of the fund.
In short, we believe that TAIL provided a near-mirror-image of opposite returns of the S&P 500 as it fell from its all-time-high to its bear-market low. Perhaps the easiest way to evaluate this is by beginning on February 14th, which was the S&P’s all-time-high, then tracking its performance from that date forward, compared with TAIL’s performance all the way to March 23rd which is the date of the S&P 500 bottom.
In addition to comparing TAIL to the S&P we also compare it to the Bloomberg Barclays Short-Term Treasury Index, which measures the performance of the US Treasury bills, notes, and bonds under 1 year to maturity. We offer this information since, from a legal, compliance perspective, TAIL’s closest performance benchmark is considered to be this index, the Bloomberg Barclays Short-Term Index. For simplicity, we’ll just call it “the Barclays Index” for the rest of the pod.
So, as the S&P hit it’s low on March 23rd, down that 33%, TAIL posted a gain of up 28.44%, and the Barclays index was up just 0.63.
Again, at the conclusion of this podcast, we’ll provide standardized performance numbers for TAIL, the Barclays Index, and the S&P 500. And please make sure to listen for it, but at this point, let’s continue describing the scenario.
We believe that, as markets fell at one of the fastest rates in history, TAIL performed exactly as intended, which – again – is to post gains that approximate the size of losses happening in the S&P 500.
And bottom line, we’re proud of the performance in this real-time, non-hypothetical study, and believe it illustrates how TAIL offers investors a way to play defense against markets in freefall.
Now, as we stand here today in mid-May, 2020, the S&P 500 has staged a vigorous-monster recovery. And as would be expected, TAIL has fallen in value. This is an important reminder for all investors about how TAIL is structured, and how using it strategically is generally more appropriate for the average investor than making it a core part of the portfolio.
As mentioned earlier, TAIL’s strategy involves paying put-option-premiums to mitigate downside market risk. This means in a flat-to-rising market, one would expect a tail risk allocation of U.S. government bonds and S&P 500 put options to produce muted, flat, or even negative yearly returns. That’s because if the market doesn’t roll over during the life of the purchased put option – which would increase its value – then that money would be a sunk cost. And that’s obviously a headwind to overall portfolio returns.
And another headwind for any fund is expense ratios and cost of ownership. And as we’re happy to report, that as of April 30th, 2020. Cambria TAIL ETF, at 0.59%, has the lowest prospectus net expense ratio in the entire Morningstar Bear Market category, out of 59 funds. Pretty cool.
So is the stock market back on solid footing today? Who knows. Nobody has a crystal ball. If I told you a year ago, however, that unemployment would jump from low single digits around 4% to over 15% today, probably closer to 20, that Fed interest rates would fall from 2.5% to near zero, gold would be up massively, stock volatility would be up, oil would crash down over 50%, and yet, despite all of this, stocks would be up over the past 12 months. Would you believe me? Most wouldn’t. But if you’re concerned about your stock portfolio, perhaps it’s time you looked closer at how you might help manage downside risk. One idea is the Cambria Tail Risk ETF. We believe that is a powerful example of how, when used strategically and opportunistically, TAIL can help not just defend a portfolio against drawdowns, but profit. For more information, you can visit CambriaFunds.com or reach out to me at 310.683.5500.
Thanks for listening friends, and good investing.
Disclosure: Here is some required standardized performance for your reference.
As of March 31, 2020, over the past year, TAIL’s net asset value, and its market price returned 18.44% and 18.31% respectively, while the Barclays Index and the S&P 500 Index returned 2.64% and -6.98% respectively. Over the 3 year period, the Barclays Index and the S&P 500 returned 1.96% and 5.10% respectively. Over the 5 year period, the Barclays Index and the S&P 500 returned 1.32% and 6.73% respectively. Over the 10 year period, the Barclays Index and the S&P 500 returned 0.74% and 10.53% respectively. Since the fund’s inception on April 6, 2017, TAIL’s net asset value and it’s market price returned -0.30% and -0.27% since inception, while the Bloomberg Barclays Short Term Index and the S&P 500 Index returned 1.96% and 5.26% respectively. Short term performance may not be indicative of long term performance. Actual results will vary. Past performance does not guarantee future results. The investment return and principal value of an investment will fluctuate so that an investor’s shares, when redeemed, may be worth more or less than their original cost and current performance may be lower or higher than the performance quoted. The closing market price is the Mid-Point between the Bid and Ask price as of the close of exchange. Since the Fund’s Shares typically do not trade in the secondary market until several days after the Fund’s inception, for the period from inception to the first day of secondary market trading in Shares, the NAV of the Fund is used to calculate market returns.
Shares are bought and sold at market price (closing price) not net asset value (NAV) are not individually redeemed from the Fund. Market price returns are based on the midpoint of the bid/ask spread at 4:00 pm Eastern Time (when NAV is normally determined), and do not represent the return you would receive if you traded at other times. Buying and selling shares will result in brokerage commissions. Brokerage commissions will reduce returns.
To determine if this Fund is an appropriate investment for you, carefully consider the Fund’s investment objectives, risk factors, charges and expense before investing. This and other information can be found in the Fund’s prospectus which may be obtained by calling 855-383-4636, also known as (ETF INFO) or visiting our website at www.cambriafunds.com. Read the prospectus carefully before investing or sending money.
The Cambria ETFs are distributed by ALPS Distributors Inc., 1290 Broadway, Suite 1000, Denver, CO 80203, which is not affiliated with Cambria Investment Management, LP, the Investment Adviser for the Fund.
A Few Definitions:
Liquid Alternatives: A category of investment strategies that are designed to implement what are traditionally considered alternative investment strategies such as trend following, managed futures, or long-short market neutral equity, as examples, but offer them in investment structures, or vehicles, like mutual funds, ETFs, and closed-end funds that provide daily liquidity.
Trend Following: Generally defined as an investment strategy that seeks to implement investment decisions based on the trend in an asset’s price.
Managed Futures: Generally defined as an investment strategy that seeks to hold a diversified, managed portfolio of futures contracts.
Long-Short Market Neutral Equity: An investment strategy that seeks to gain from taking both long and short positions in assets, with an overarching portfolio management goal of reducing or ‘neutralizing’ the impact of returns from specific market segments or the broad market.
Out of the money (OTM) describes a call option whose strike price is higher than that of the underlying investment, or a put option whose price is lower than that of the underlying security. An OTM option has no intrinsic value.
Strike Price describes the price at which the put option can be exercised
An option premium is the dollar price per share that an option holder pays the option writer for the option privileges.
ETFs are subject to commission costs each time a “buy” or “sell” is executed. Depending on the amount of trading activity, the low costs of ETFs may be outweighed by commissions and related trading costs.
Diversification may not protect you against market loss.
There is no guarantee that the Fund will achieve its investment goal. Investing involves risk, including the possible loss of principal.
The Fund is actively managed.
Derivatives are financial instruments that derive their performance from an underlying reference asset, such as an index. Derivatives, such as put options, can be volatile, and a small investment in a derivative can have a large impact on the performance of the Fund as derivatives can result in losses in excess of the amount invested. Options used by the Fund to offset its exposure to tail risk or reduce volatility may not perform as intended. There can be no assurance that the Fund’s put option strategy will be effective. The put option strategy may not fully protect the Fund against declines in the value of its portfolio securities.
2020 Morningstar. All Rights Reserved. The information contained herein: (1) is proprietary to Morningstar and/or its content providers; (2) may not be copied or distributed; and (3) is not warranted to be accurate, timely or complete. Neither Morningstar nor its content providers are responsible for any damages or losses arising from any use of this information. Past performance is no guarantee of future results.
CBM000145
