“When the facts change, I change my mind. What do you do?
Though there’s debate about who originally said this, or if the phrasing is accurate, popular opinion gives credit to John Maynard Keynes.
In any case, it’s relevant today because the facts have just changed for investors. And that points toward an important question each of us would be wise to answer as soon as possible…
What are you going to do now?
I’ll explain exactly what’s changed in a moment. First, let’s establish some context.
The two primary pillars upon which we build our portfolios are value, and momentum and trend. Specifically, our main value framework is the shareholder yield strategy that invests in stocks trading at what we consider to be attractively-low valuations relative to their price, and distributing their cash flows to shareholders.
On the other hand, we implement a global momentum and trend strategy that seeks out the highest global momentum assets that are also in an uptrend, regardless of valuations.
Sometimes value and trend line up together – my favorite, a cheap investment in an uptrend!
But many times, value and trend disagree.
That’s been the case for some time now with the broad U.S. stock market. By just about every valuation metric, the S&P 500 is very expensive yet still in an uptrend. (We would say “every” valuation metric but it’s unwise to speak in absolutes in the investing world…)
Though the inflated valuation aspect of this type of market condition can result in anxiety for investors, historically this environment still generates positive broad market returns. After all, “uptrend” is driving the market.
You might think of this market environment as being a yellow light suggesting caution. That’s because the next quadrant – expensive in a downtrend – is a full-on bright red light because it can wreak havoc on a portfolio.
When the market sours and enters expensive/downtrend conditions, gains that accrued over quarters and years can evaporate rapidly. Just look at the most recent flash-bear-market in 2020. It took the S&P only 22 trading days to fall 30% from its prior high.
Historically speaking, markets have performed poorly when in a downtrend, characterized by higher volatility and drawdowns.
So, returning to the top of this post, what’s changed today?
You guessed it.
“Trend” has officially gone from “up” to “down.”
This suggests investors need to think hard about how they’re positioned.
What the Changing Trend Means Exactly
There are many ways to measure a trend.
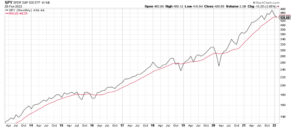
For our purposes today, we’re looking at the 10-month simple moving average (similar to the often referenced 200-day simple moving average). This is generally considered a long-term trend indicator.
When prices are north of this long-term trend-line, many investors consider the market to be in a bullish up trend. The converse is equally true.
When the S&P’s price falls below its 10-month simple moving average, we see that as the equivalent of the curve in the chart below peaking and turning south.
We measure this by looking at the 10-month simple moving average of the S&P 500 total return series at the end of each month. And it’s very close, but SPY just closed below this trend line for the first time since 2020.
Here’s how that looks:
Now, does this mean the stock market is about to implode?
No.
Or rather, there’s no guarantee that will happen.
Trend indicators on U.S. stocks have experienced many whipsaws and head-fakes over the past decade.
That’s happened when a market drop triggered what appeared to be a new down trend, only to reverse and rip higher. Plenty of trend investors have fallen for such pump fakes, resulting in whipsaw losses.
No market signal is perfect. But we’d be very foolish to ignore what the trend is telling us right now.
What then, can you do?
Investing in “Expensive/Downtrend” Market Conditions
First, let’s illustrate what we’re trying to avoid.
Below is a chart of the S&P 500’s CAPE ratio dating back to the 1800s (via multpl). The CAPE ratio stands for the cyclically-adjusted-price-to-earnings ratio. Rather than a traditional price-to-earnings ratio, CAPE stretches earnings over a 10-year period. This is done to smooth out business-cycle fluctuations.
As I write, the CAPE ratio is at an elevated 35 – despite the correction we’re undergoing.
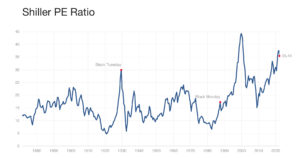
This puts today’s market conditions deep in the overvalued category.
Translation, watch out, “forward-looking 10-year S&P 500 returns.”
So, what does that mean in practical, actionable terms?
First, you don’t have to invest 100% in stocks.
We often say the best way to hedge a risk is to not take the risk in the first place. No one says you must invest your entire portfolio in equities. So instead of 100% in stocks, investors could own 80%, or 60%, or even less with the remainder in cash or bonds.
Second, you don’t have to limit yourself to only U.S. markets.
We feel this choice is a no-brainer. We’ve spoken often over the past few years about how moving into cheaper foreign equities can be a wise choice in a world dominated by more expensive U.S. shares.
Third, you could add liquid alternatives. Think real assets like commodities and real estate. Our global momentum and trend strategy is heavily invested in real assets today. If inflation remains elevated, real assets could be a big beneficiary.
We see this as a benefit for investors because the fund itself adapts to changing market conditions, freeing the investor from having to keep track of shifting markets and reposition his/her portfolio manually.
Incorporating strategies like trend following and managed futures, or long short and market neutral equity, can also help to hedge equity risks if equity markets decline.
Now, most investors are familiar with these options. But there’s a fourth one, and while it too is defensive, if used tactically, it can also be an offensive strategy.
To be clear, it’s not for everyone. It’s probably also not for “all the time.” That said, when used wisely and strategically, it has the ability not only to help hedge a portfolio during drawdowns, but positions the portfolio to potentially profit from it.
We’re referencing our tail risk strategy.
How Tail Risk Might Be a Helpful Component of Your Portfolio
Our tail risk strategy invests in a ladder of puts on the U.S. stock market, paired with long positions in U.S. Government bonds.
A put option is an option contract giving the owner the right, but not the obligation, to sell a specified amount of an underlying security at a specified price within a specified time frame.
The basic idea is that if the market (or your stocks) rolls over, a put option you’ve previously purchased will enable you to either sell your equities at the pre-determined strike price (play defense), or if you don’t own the underlying investment, you’ll be able to profit as the underlying’s market price falls, therein increasing the value of the put you own (play offense).
The portion of our strategy invested in U.S. Government bonds is engineered to spin off the cash-flow from those bonds to help fund the cost of the puts.
In a normal, rising market, this means tail risk may not be appropriate for the portfolio of the average investor. However, when downward volatility strikes, it could make far more sense.
The challenge is how do you know when downward volatility is more likely to strike?
Well, perfect timing is impossible.
But we believe the yellow-to-red trend indicator we’ve detailed today suggests that the market is more likely to experience significant drawdowns than before.
Wrapping up, the S&P has now officially closed a month with its price below its 200-day simple moving average. That’s a long-term red light warning sign.
Given your unique financial situation, how will you respond?
If you believe that hedging your long U.S. stock exposure, or even take a bearish view of the stock market is the right call, tail risk could be appropriate for you.
