Monthly Archives: August 2025

#20: “The Big ETF Shops Shut Down The Most Funds”

We often get questions from individual investors worried about my firm closing our ETFs. To which I respond “well we’ve only closed one ETF ever (with the unfortunate ticker FAIL, why didn’t any of you warn me on that one). The firms that close the most funds are actually the big shops!”

This usually surprises people, but here is Ben Johnson from Morningstar with the numbers….


#19: “You Might Be Paying Annual Cap Gains On Your Mutual Fund Even If You Don’t Sell And It’s Down On The Year”

A lot of people don’t realize this, but you could own a mutual fund, have losses on that fund, and STILL have to pay major capital gains taxes…say what?! (Article from Russell.)

Morningstar has an annual report that covers some particularly big distributions, and usually there are fund distributing 20, 40% or more!

Here is a table from S&P that demonstrates the tax drag for investors…one could make the argument that owning high fee tax inefficient mutual funds in a taxable client account is malpractice. 


#18: “Your Asset Allocation Can Go A Long, Long Time Underperforming the S&P 500”

Most investors take an asset allocation approach to investing. They understand diversification will smooth their path vs. a stock-only benchmark like the S&P 500. But do they realize just how long they can underperform?

If you ask most investors how long they can handle underperforming, they usually say just a few years. (Polls here, here, and here.)

We examined how long various portfolios can underperform the S&P 500 in my paper “A Bear Market in Diversification“.

The best-performing asset allocation model in my old GAA book (free download) underperformed the S&P500 for…wait for it…

TWELVE YEARS IN A ROW (ending 2022). This period is argueably the worst underperformance in history in terms of magnitude and length. The only comparable period would be post WWII.

No wonder everybody is all in on US stocks at any price. However, with markets shifting in 2025 have we entered the “Bull Market for Diversification”….we think so….


#17: “Global Stocks Have Better Risk-Adjusted Returns Than US Stocks”

US stocks have outperformed just about everything the past 125 years at about 10% per year. Astonishing.

A global portfolio (including US stocks) would have underperformed by about one percentage point a year. Doesn’t sound like much but adds up!

However, only investing in one country exposes the investor to specific risks. Historically, diversifying globally would have increased your Sharpe ratio from 0.37 to 0.42. It would also reduced volatility and drawdowns (the US stock market went down over 80% in the Great Depression).

Diversifying away from the best investment ever doesn’t sound like a good idea, but at least historically, it has been. 

#16: “Stocks Can Go A Long, Long Time With No Returns”

The US stock market has never had a period of 20 years where stocks have lost money, even after inflation. 

However, for MOST stock markets, that is not the case. Some have gone 20, 40, 60, 80, years with no real returns. Think about that for a bit before you decide to go all in on one country….

Via DMS crew

#15: “Whatever The World Is Going Through, It’s Probably Been Worse Before…”

people love to complain about how bad things are, but let’s be clear they’ve been way worse

Via HistoryinMemes

Worst Year Ever:

“2020 was a terrible year, but it’s still far from being the worst in recorded human history. Here are a few bad ones: 1349 was the peak of the Black Death, which killed an estimated 75 to 200 million people in Europe, Eurasia, and North Africa. It is considered the deadliest pandemic in human history. 1520 was when smallpox spread across the Americas, killing an estimated 90% of the Indigenous population. It is estimated that 25 to 55 million people perished. 1918 was when the influenza pandemic killed an estimated 50 million people across the globe. As many as 500 million people were infected. These were all terrible years, but many historians believe that the absolute worst was 536 AD. According to medieval historian, Michael McCormick, “It was the beginning of one of the worst periods to be alive, if not the worst year.” So what exactly happened in 536? Well for starters, a volcano erupted in Iceland, which dimmed the sun for 18 months, causing temperatures to decrease by 1.5 to 2.5 degrees Celsius. This led to the coldest decade (536 to 545) in 2,000 years, leading to crop failures and mass starvations in Europe, Mesopotamia, and China. In 540 there was another volcanic eruption, this time in Ilopango, El Salvador, which killed tens of thousands of people and decreased global temperatures once again. In 541, the Plague of Justinian began to spread throughout the Mediterranean Basin and would kill 35 to 55% of the population. The plague would greatly weaken the Byzantine Empire after devastating its capital, Constantinople. The natural disasters, crop failures, and the plague would go on to decimate Europe’s economy, which would not recover until 640, more than a century later. Ice core records show that in 640, there was a spike in atmospheric lead pollution which was the result of an increase in silver mining. Silver is found in lead-rich galena ores. During this time, periods of prosperity almost always coincided with increases in lead emissions. Keep in mind that this is just from recorded history. Imagine all the crazy stuff that happened in prehistory, including population bottlenecks, which reduced the human population to just tens of thousands of people. We could have easily gone extinct on a number of occasions.”

Via @HistoryInPics

Being Born in 1900:

“For a quick moment, imagine you were born in 1900. When you are 14, World War I starts, and ends on your 18th birthday with 22 million people killed. Later in the year, a Spanish Flu epidemic hits the planet and runs until you are 20. Fifty million people die from it in those two years. Yes, 50 million. When you’re 29, the Great Depression begins. Unemployment hits 25%, global GDP drops 27%. That runs until you are 33. The country nearly collapses along with the world economy. When you turn 39, World War II starts. You aren’t even over the hill yet. When you’re 41, the United States is fully pulled into WWII. Between your 39th and 45th birthday, 75 million people perish in the war and the Holocaust kills six million. At 52, the Korean War starts and five million perish. At 64 the Vietnam War begins, and it doesn’t end for many years. Four million people die in that conflict. Approaching your 62nd birthday you have the Cuban Missile Crisis, a tipping point in the Cold War. Life on our planet, as we know it, could well have ended. Great leaders prevented that from happening. As you turn 75, the Vietnam War finally ends. Think of everyone on the planet born in 1900. How do you survive all of that? A child in 1985 didn’t think their 85 year old grandparent understood how hard school was. Yet those grandparents survived through everything listed above. Perspective is an amazing thing. With so much happening right now and as 2023 ends, let’s try to keep things in perspective, knowing that we will get through all of this. In the history of the world, there has never been a storm that lasted forever. This too shall pass.”

Via Max Roser HT Bob Elliott

#14: “Utilities and the Nasdaq Have the Same Return”

Utilities and the Nasdaq have similar performance over the past 40+ years… ¯\_(ツ)_/¯ 

#13: “What Country (and What State) You’re Born in Influences Your Allocation”

Most of us like to think we’re independent, logical thinkers. Silly inputs like where, or when we’re born shouldn’t affect our investment process…right? 

Right?

We’ve talked a lot about home country bias over the years, but it also turns out there is state bias and birth bias (not sure those are real phrases)…

Instead of narrating all the below charts we’ll just let the pictures tell the story…

Historically, making these huge, concentrated, regional bets is a terrible no good idea!


#12: You May Be Getting Paid To Invest

Most investors LOVE to obsess over fees, as they should. But most investors also overlook a critical input to the total fee costs that could even result in a negative expense ratio, meaning, you get paid to own the fund!

That sounds like something you’d see advertised on Instagram, right?

Nope “Thirty-four ETFs earned a higher securities-lending return than their annual fee in 2024.”

ETFs That Pay You to Invest

#11: You Don’t Have to Own US Stocks

I view diversification not only as a survival strategy but as an aggressive strategy because the next windfall might come from a surprising place.” – Peter Bernstein

What is the single most universally held belief in all of investing?

Think about it for a minute.

Our vote would be “Investors MUST own US stocks.”

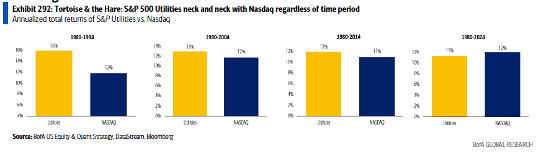
It has been well established that US stocks have historically outperformed bonds over time, and likewise, US stocks have outperformed most foreign stock markets as well as other asset classes.

How many times have you seen a version of this chart?

Figure 1 – Asset Class Returns


It feels like US stocks have compounded at around 10% for just about forever, and the crazy math outcome is that if you compound an investment at 10% for 25 years, you 10x your money, and after 50 years you 100x your money.

$10,000 plunked down at age 20 would grow to $1,000,000 in retirement. Amazing!

For the past 15 years, it’s been even better than that. US stocks have compounded at around 15% per year since the bottom of the Global Financial Crisis, outperforming almost every asset over this period. This outstanding performance has led to a near universal belief that US stocks are “the only game in town.” Beliefs lead to real world behavior.

Now don’t get us wrong, Stocks for the Long Run is one of our all-time favorite books. Indeed, US stocks probably should be the bedrock starting point for most portfolios.

But it feels like everyone is “all in” on US stocks. A recent poll of Meb’s Twitter followers found that 94% of people said they hold US stocks. That’s no surprise. But when everyone is on the same side of the same trade, well, that’s usually not a recipe for long-term outperformance.

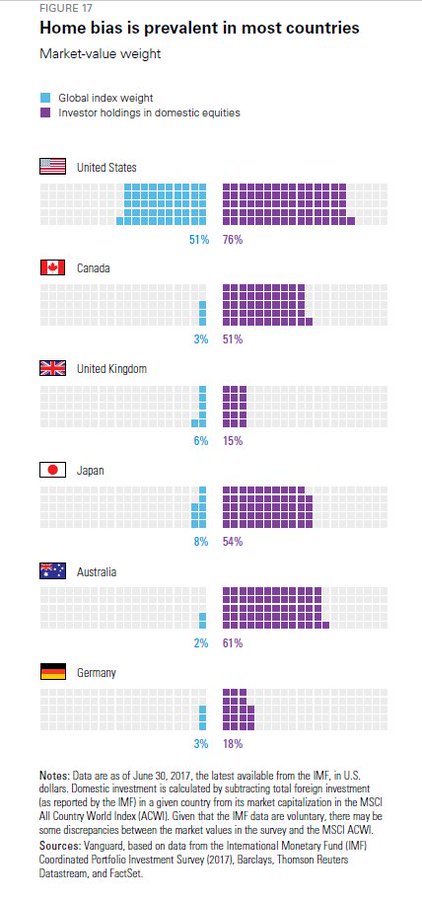
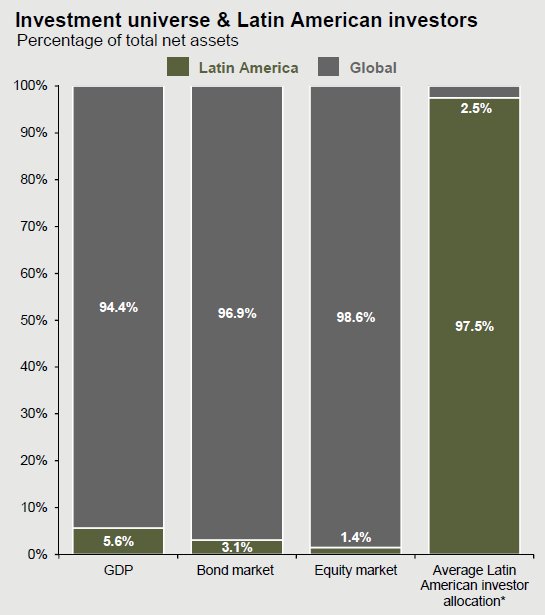
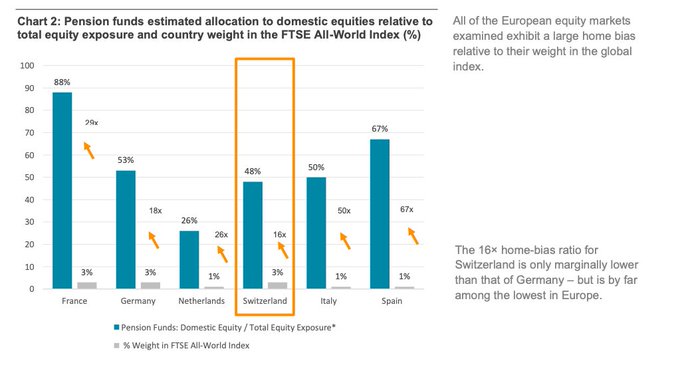
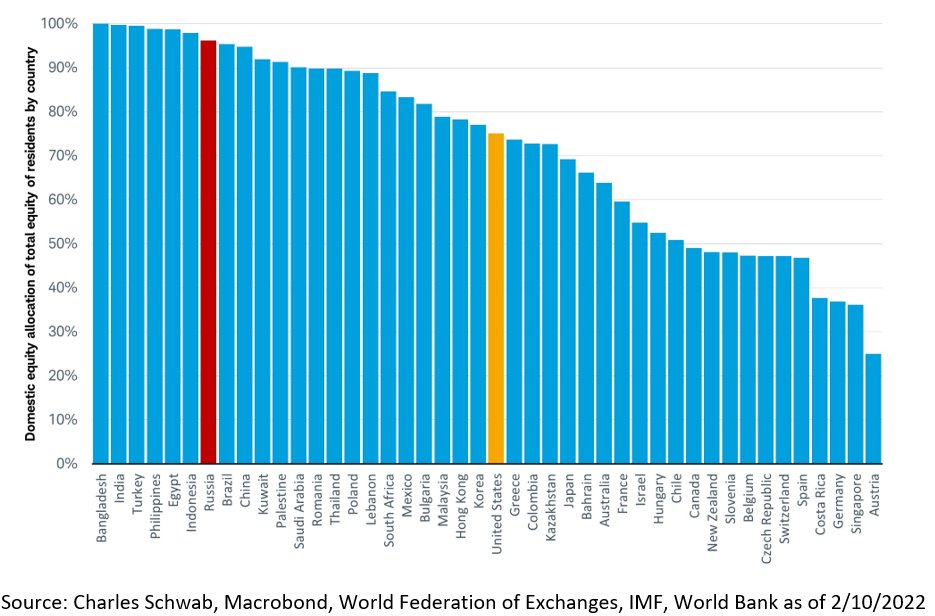
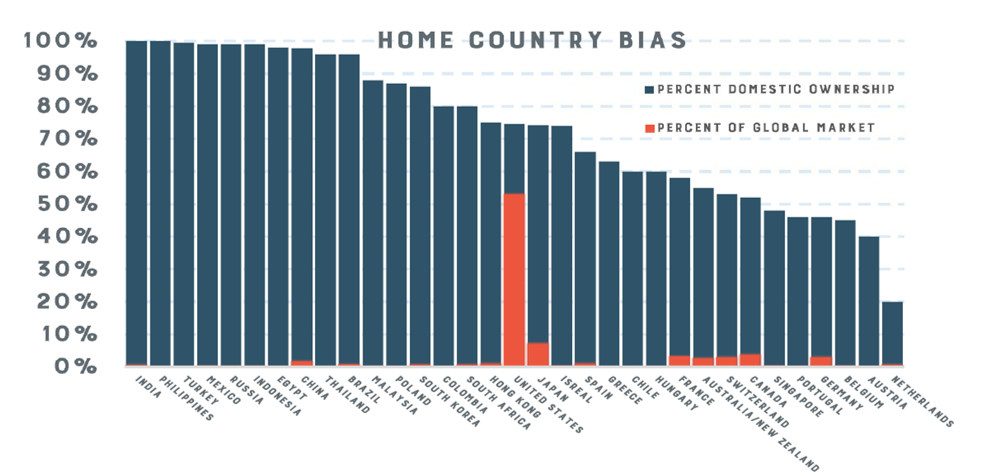
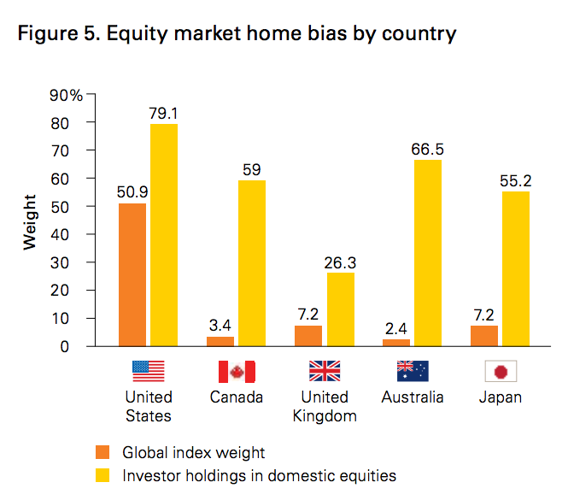
Despite US stocks accounting for roughly 64% of the global market cap, most US investors invest nearly all of their equity portfolio in US stocks. That is a big overweight bet on US stocks vs. the index allocation. (If this is you, pat yourself on the back, as US stocks have outperformed just about everything over the past 15 years, which feels like an entire career for many investors.)

We are currently at the highest point in history for stocks as a percentage of household assets. Even higher than in 2000.

Given the recent evidence, it seems like investors may be well served by putting all their money in US stocks…

So why are we about to question this sacred cow of investing?

We believe there are many paths to building wealth. Relying on a concentrated bet in just one asset class in just one country can be extremely risky. While we often hear investors describe their investment in US market cap indexes as “boring,” historically, that experience has been anything but.

Consider, US stocks declined by over 80% during the Great Depression. Many investors can recall the more recent Internet bust and Global Financial Crisis where stocks declined by around half during each bear market.

That doesn’t sound boring to us.

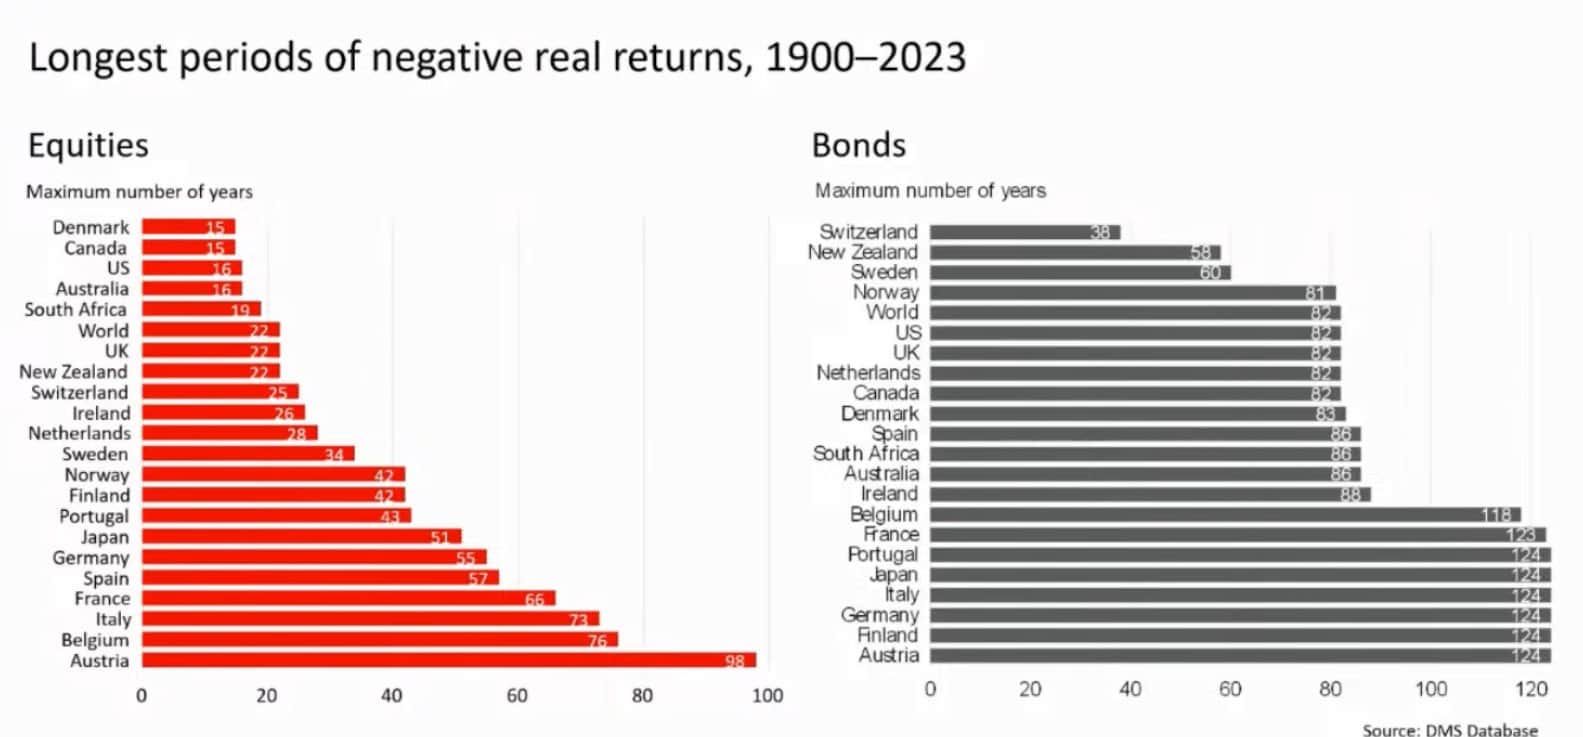
US stocks can also go very long periods without generating a positive return after inflation or even underperforming something as boring as cash and bonds. Does 68 years of stocks underperforming bonds sound like a lot? Most people struggle with only a few years of underperformance, try an entire lifetime!

So, let’s do something that no sane investor in the entire world would do.

Let’s get rid of your US stocks.

Say what?!

This move will likely doom any portfolio to failure. Investors will be eating cat food in retirement. Right?

Let’s check our biases at the door and try a few thought experiments.

We’ll examine one of our favorite portfolios, the global market portfolio (GAA). This portfolio tries to replicate a broad allocation where you own every public asset in the entire world. This total is over $200 trillion last we checked.

Today, if you round the portfolio allocation, it is approximately half bonds and half stocks, and roughly have US and half foreign. There’s a little bit of real estate and commodities thrown in too, but lots of real estate is privately held, as is farmland. (We examine various asset allocation models in my free book Global Asset Allocation.)

This portfolio could be called the true market portfolio or maybe “Asset Allocation for Dummies” since you don’t actually “do anything”; you just buy the market portfolio and go about your business. Shockingly, this asset allocation has historically been a fantastic portfolio. In the recent article, “Should CalPERS Fire Everyone and Just Buy Some ETFs?”, Meb even demonstrated that both the largest pension fund and the largest hedge fund in the US have a hard time beating this basic “do nothing” portfolio.

Now, what if you decided to eliminate US stocks from that portfolio and replace them with foreign stocks? Surely this insane decision would destroy the performance of the portfolio?!

Here is the GAA portfolio and GAA portfolio ex US stocks with risk and return statistics back to 1972.

Figure 2 – Asset Allocation Portfolio Returns, With and Without US Stocks, 1972-2022
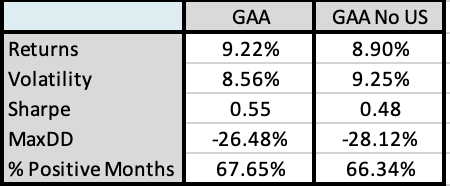


Source: GFD

Virtually no difference?! These results can’t be true!

You lose out on less than half of one percent in annual compound returns. Not optimal, but still totally fine. Anytime you reduce the universe of investment choices, the risk and return figures often decrease due to diminishing breadth.

When we have presented these findings to investors, the standard reaction is disbelief, followed by an assumption that we must have made a math error somewhere.

But there’s no error. You can barely tell the difference when you eyeball the equity curves of the two series.

Figure 3 – Asset Allocation Portfolio Returns, With and Without US Stocks, 1972-2022
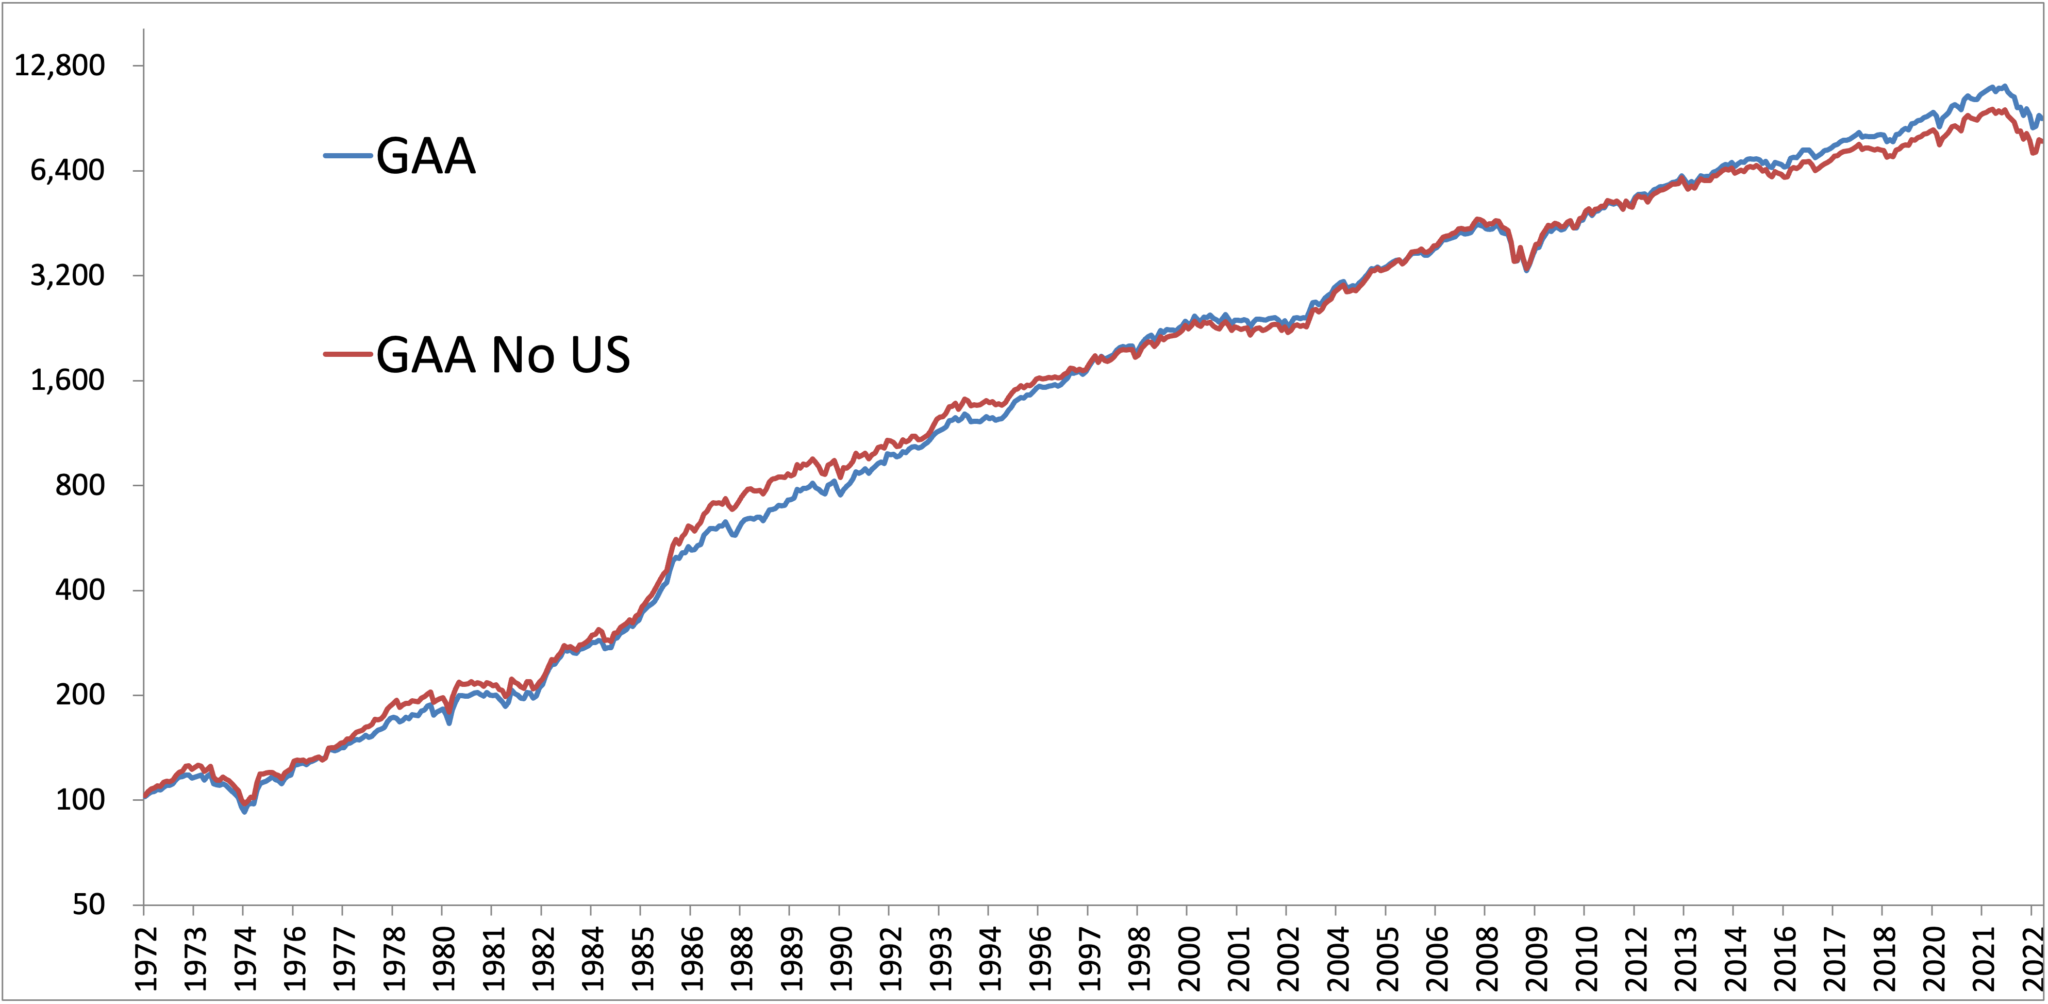


Source: GFD

If you zoom out and run the simulation over the past 100 years, the results are consistent – about a 0.50% difference.

You likely don’t believe us, so let’s run another test.

Do you remember the old Coke vs. Pepsi taste tests?

Let’s run the investment equivalent to see just how biased you are.  Below are two portfolios. Which would you prefer?

 Figure 4 – Asset Allocation Portfolio Taste Test, 1972-2022
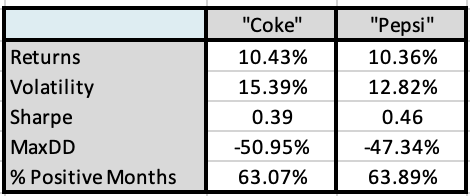


Source: GFD

It’s pretty hard to tell the difference, right?

This may surprise you, but column A is US stocks. Column B is a portfolio made up of foreign stocks, bonds, REITs, and gold, with a little leverage thrown in. (Our friends at Leuthold call the concept the Donut Portfolio.)

Both portfolios have near identical risk and return metrics.

The surprising conclusion – you can replicate the historical return stream of US stocks without owning any US stocks.

There’s no reason to stop here…

It is very simple to construct a historical backtest with much superior risk and return metrics than what you’d get investing in US stocks alone. Moving from market cap weighted US stocks to something like a shareholder yield approach historically has added a few percentage points of returns in simulations. Additions such as a trend following approach can be hugely additive over time in the areas of diversification and risk reduction. We believe that investors can achieve higher returns with lower volatility and drawdown with these additions. For more details, we’d direct you to our old Trinity Portfolio white paper…)

Despite not necessarily needing US stocks, for most of us, they’re the starting point. They’re nice to have but you don’t HAVE to own them, and certainly not with the entirety of your portfolio.

As the US stock market is showing some cracks while trading near record valuation territory, maybe it is time to reconsider the near universally held sacred belief…

“You have to be all in on US stocks.”