Pension funds’ annualized aggregate returns since 2000 have been virtually identical to a simple 60-40 index portfolio.
That feels somewhat expected it seems, but what about the true crème de la crème, the top institutions. Surely they could beat a simple buy and hold allocation?
Turns out, they really can’t. Below we recall an article we penned a few years ago, “Should CalPERS Fire Everyone and Buy Some ETFs?”
“He was a U.S.-class smooth politician, which is the only way you’re going to survive in that job. It has nothing to do with investing.”
That’s how Institutional Investor recently described a former CIO of the California Public Employees’ Retirement System, also known as CalPERS.
The description is especially interesting when considering that the “I” in “CIO” stands for “investment,” which raises an eyebrow at how the role could have “nothing to do with investing”.
For readers less familiar with CalPERS, it manages pension and health benefits for over one million public employees, retirees, and their families. They oversee the largest pension fund in the country, valued at over $450 billion.
With that massive amount of assets comes a great deal of scrutiny over how those assets are deployed. The CIO role managing this pension is one of the most prestigious and powerful in the country, hence Institutional Investor’s interest. Apparently, it’s also one of the hardest roles to hold down. The position has averaged a new CIO roughly every other year for the past decade.
Now, this article isn’t going to spend a great deal of time on CalPERS governance, as many others have spilled a great deal of ink there. Plus, the drama surrounding the pension is never-ending and will likely feature a new twist by the time we publish our article. (To be fair, Harvard’s endowment issues are nearly equally as dramatic…)
Instead, we’re going to use CalPERS’ investment approach as a jumping-off point for a broader discussion about portfolio allocation, returns, fees, and wasted effort. And if we do our job correctly, we hope you’ll feel just a bit less stress about your own portfolio positioning by the time we’re done.
The staggering waste of CalPERS market approach
CalPERS’ stated mission is to “Deliver retirement and health care benefits to members and their beneficiaries.”
Nowhere in this mission does it state the goal is to invest in loads of private funds and pay the inflated salaries of countless private equity and hedge fund managers. But that is exactly what CalPERS’ does.
The pension’s Investment Policy document – and we’re not making this up – is 118 pages long.
Their list of investments and funds runs 286 pages long. (Maybe they need to read the book “The Index Card”.)
Their structure is so complicated that for a long time, CalPERS couldn’t even calculate the fees it pays on its private investments. On that note, by far the biggest contributor to high fees is CalPERS’ private equity allocation, which they plan on increasing the allocation to. Is that a well thought out idea or is it a Hail Mary pass after years of underperformance? According to a recent CalPERs venture capital portfolio returned 0.49% from 2000 to 2020.
Now, it’s easy to criticize. But is there a better way?
Let’s examine CalPERS’ historical returns against some basic asset allocation strategies.
We’ll begin with CalPERS’ current portfolio allocation:
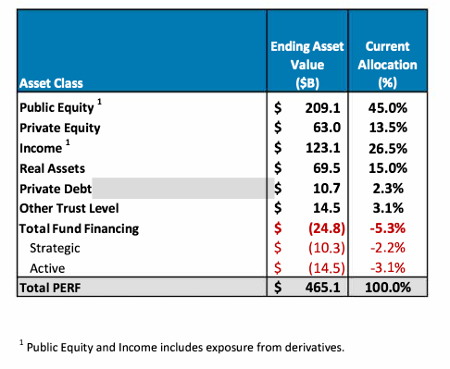
Source: CalPERS
Now, that we know what CalPERS is working with, let’s compare its returns against three basic portfolios beginning in 1985.
- The classic 60/40 US stocks and bonds benchmark.
- A global asset allocation (GAA) portfolio from our book Global Asset Allocation (available as a free eBook here). The allocation approximates the allocation of the global market portfolio of all the public assets in the world.
- A GAA portfolio with slight leverage, since many of the funds and strategies that CalPERS utilizes have embedded leverage.
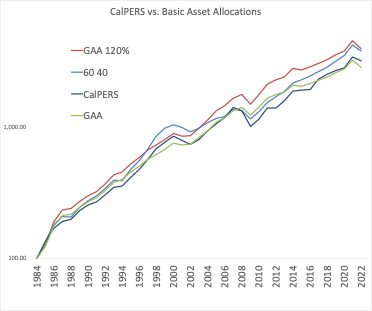
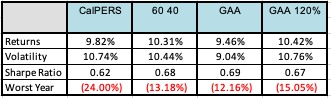
Source: CalPERS, Global Financial Data, Cambria
As you can see from the table, from 1985-2022 CalPERS fails to differentiate itself from our simple “do nothing” benchmarks.
To be clearer the returns are not bad. They’re just not good.
Consider the implications:
All the time and money spent by investment committees debating the allocation…
All the time and money spent on sourcing and allocating to private funds…
All the time and money spent on consultants…
All the time and money spent on hiring new employees and CIOs…
All the time and money spent on putting together endless reports to track the thousands of investments…
All of it – absolutely wasted.
CalPERS would have been better off just firing their whole staff and buying some ETFs. Should they call Steve Edmundson? It would certainly make the record keeping a lot easier!
Plus, they would save hundreds of millions a year on operating costs and external fund fees. Cumulatively over the years, the costs run well into the billions.
Personally, I take the “I” part of the acronym very seriously and have offered to manage the CalPERS pension for free.
“Hey pension funds struggling with underperformance and major costs and headcount. I’ll manage your portfolio for free. Buy some ETFs. Rebal every year or so. Have an annual shareholder meeting over some pale ales. Maybe write a year in review.”
I’ve applied for the CIO role three times, but each time CalPERS has declined an interview.
Maybe CalPERS should update its mission statement to “Deliver retirement and health care benefits to members CalPERS employees, private fund managers and their beneficiaries.”
In this instance, they would be succeeding mightily.
Is it just CalPERS, or is it the industry?
One could look at the results above and conclude CalPERS is an outlier.
Critics might push back, saying, “OK Meb, we get that CalPERS can’t beat a basic buy and hold, but let’s be honest – it’s the GOVERNMENT! We define our government by mediocrity. Any serious private pension or institution should be using the smart money, the big hedge fund managers.”
Fair point. So, let’s broaden our analysis.
We’ll do so by examining the largest and most famous hedge fund manager, Bridgewater. This $100 billion+ money manager offers two main portfolios, a buy and hold “All Weather” strategy and a “Pure Alpha” strategy.
In 2014, we set out to clone Bridgewater’s All Weather” portfolio – an allocation that Bridgewater says has been stress-tested through two recessions, a real estate bubble, and a global financial crisis.
The clone, based on a simple global market portfolio comprised of indexes, did a good job of replicating Bridgewater’s offering when back tested. More importantly, running the clone would have required zero hedge fund management costs and lockups, and wouldn’t have been weighed down by any tax inefficiency. To be fair, this backrest has the benefit of hindsight and pays no fees or transaction costs.
The All Weather portfolio, with its focus on risk parity, shows that if you’re building a portfolio you don’t necessarily have to accept pre-packaged asset classes.
For example, when it comes to equities, they are inherently leveraged, and most companies have debt on their balance sheet. So, there’s no reason nor obligation to take stocks at their notional value. One choice to “deleverage stocks” would be to invest half in equities and half in cash. And the same goes for bonds, you can leverage them up or down to make them more or less volatile.
This approach has been around for a long time, well over sixty years. Dating back to the days of Markowitz, Tobin, and Sharpe, the concept is essentially a super diversified buy-and-hold and rebalanced portfolio – one that Bridgewater’s founder Ray Dalio says he would invest in if he passed away and needed a simple allocation for his children.
So clearly the world’s largest hedge fund should be able to stomp an allocation one could write on an index card?
Once again, from 1998-2022 we find that a basic 60/40 or global market portfolio does a better job than the largest hedge fund complex in the world.
Source: Morningstar, Global Financial Data, Cambria
One may respond, “OK Meb, All Weather is supposed to be a buy and hold portfolio. They charge low fees. You want the good stuff, the actively managed Pure Alpha!”
What about Bridgewater’s actively managed portfolio?
Dalio separated the All Weather portfolio from Bridgewater’s Pure Alpha strategy, which is meant to be its multi-strategy, go anywhere portfolio.
His idea was to separate “beta,” or market performance from “alpha,” or added performance on top of average market returns. He believes beta is something that you should pay very little for (we’ve gone on the record in saying you should pay nothing for it).
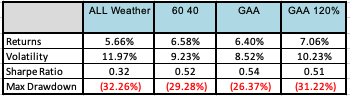
Let’s now bring the Pure Alpha strategy into the mix. Below, we’ll compare it with All Weather, the traditional 60/40 portfolio, and the Global Asset Allocation (GAA) portfolio from our book and above. Finally, the risk parity strategy uses some leverage, so we also did a test with GAA and leverage of 20%.
The replication strategy back tested the portfolios’ respective performances between 1998 and 2022.
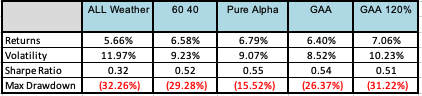
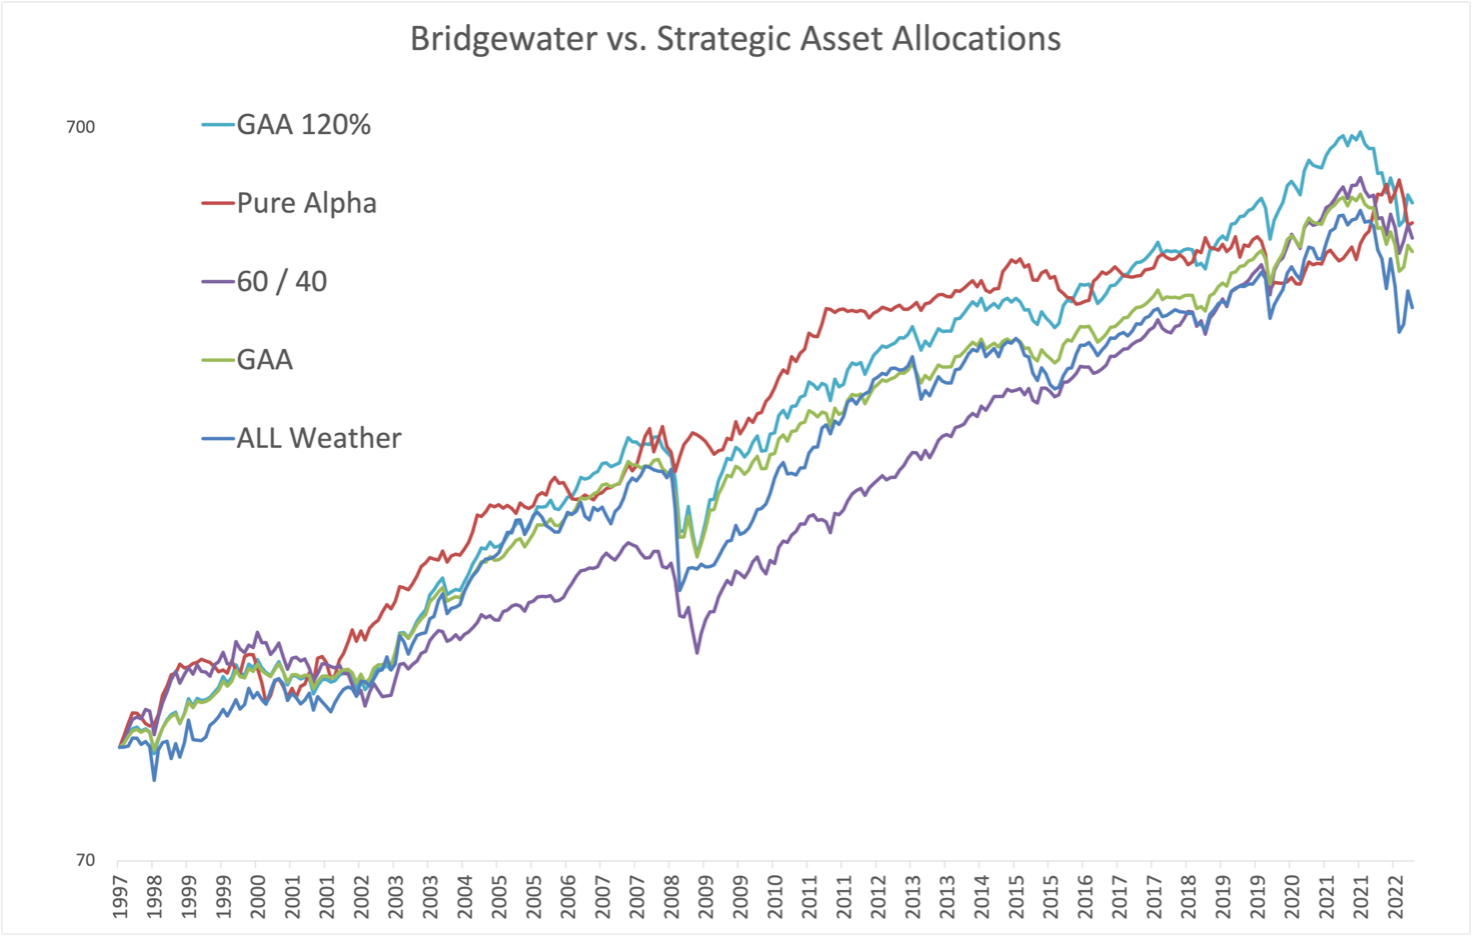
Source: Morningstar, Global Financial Data, Cambria
Once again the returns of Pure Alpha were nearly identical to the GAA and 60/40 portfolios, with performance differing by less than 0.5%. And don’t miss that Pure Alpha actually trailed the leveraged version of the GAA portfolio.
Again, this isn’t bad, it’s just not good.
Some may say, “but Dalio and the company did this in the 1990s in real time with real money.”
We absolutely tip our hat to that argument, and additionally, the Pure Alpha looks like it takes a different return path than the other allocations, likely offering some diversification benefit from the non-correlation to traditional assets. We also acknowledge that the benchmarks include a particularly strong trailing run for US stocks.
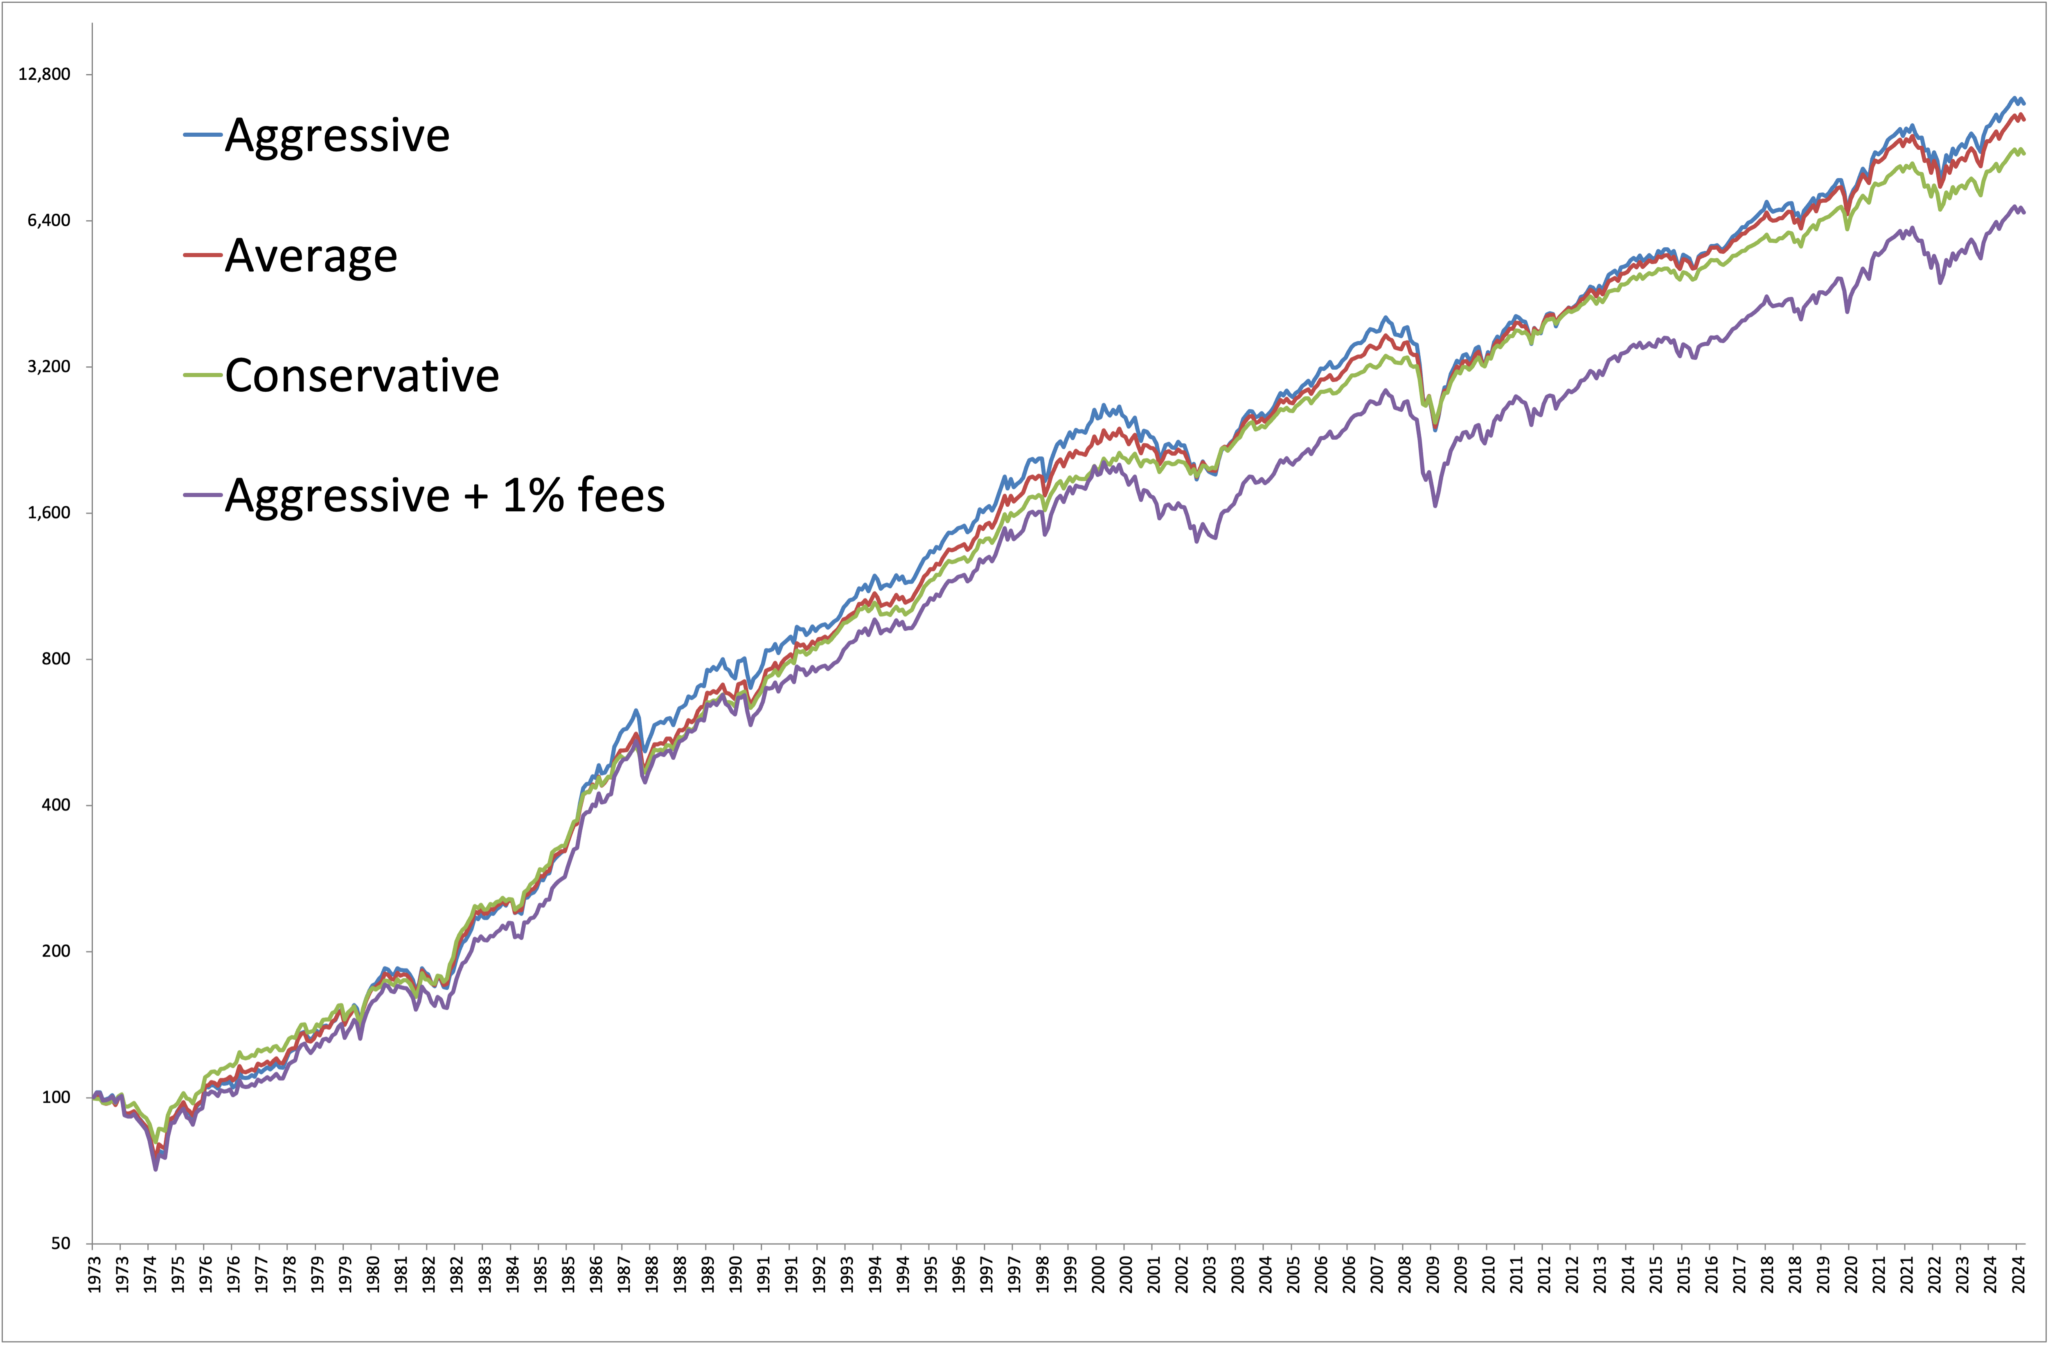
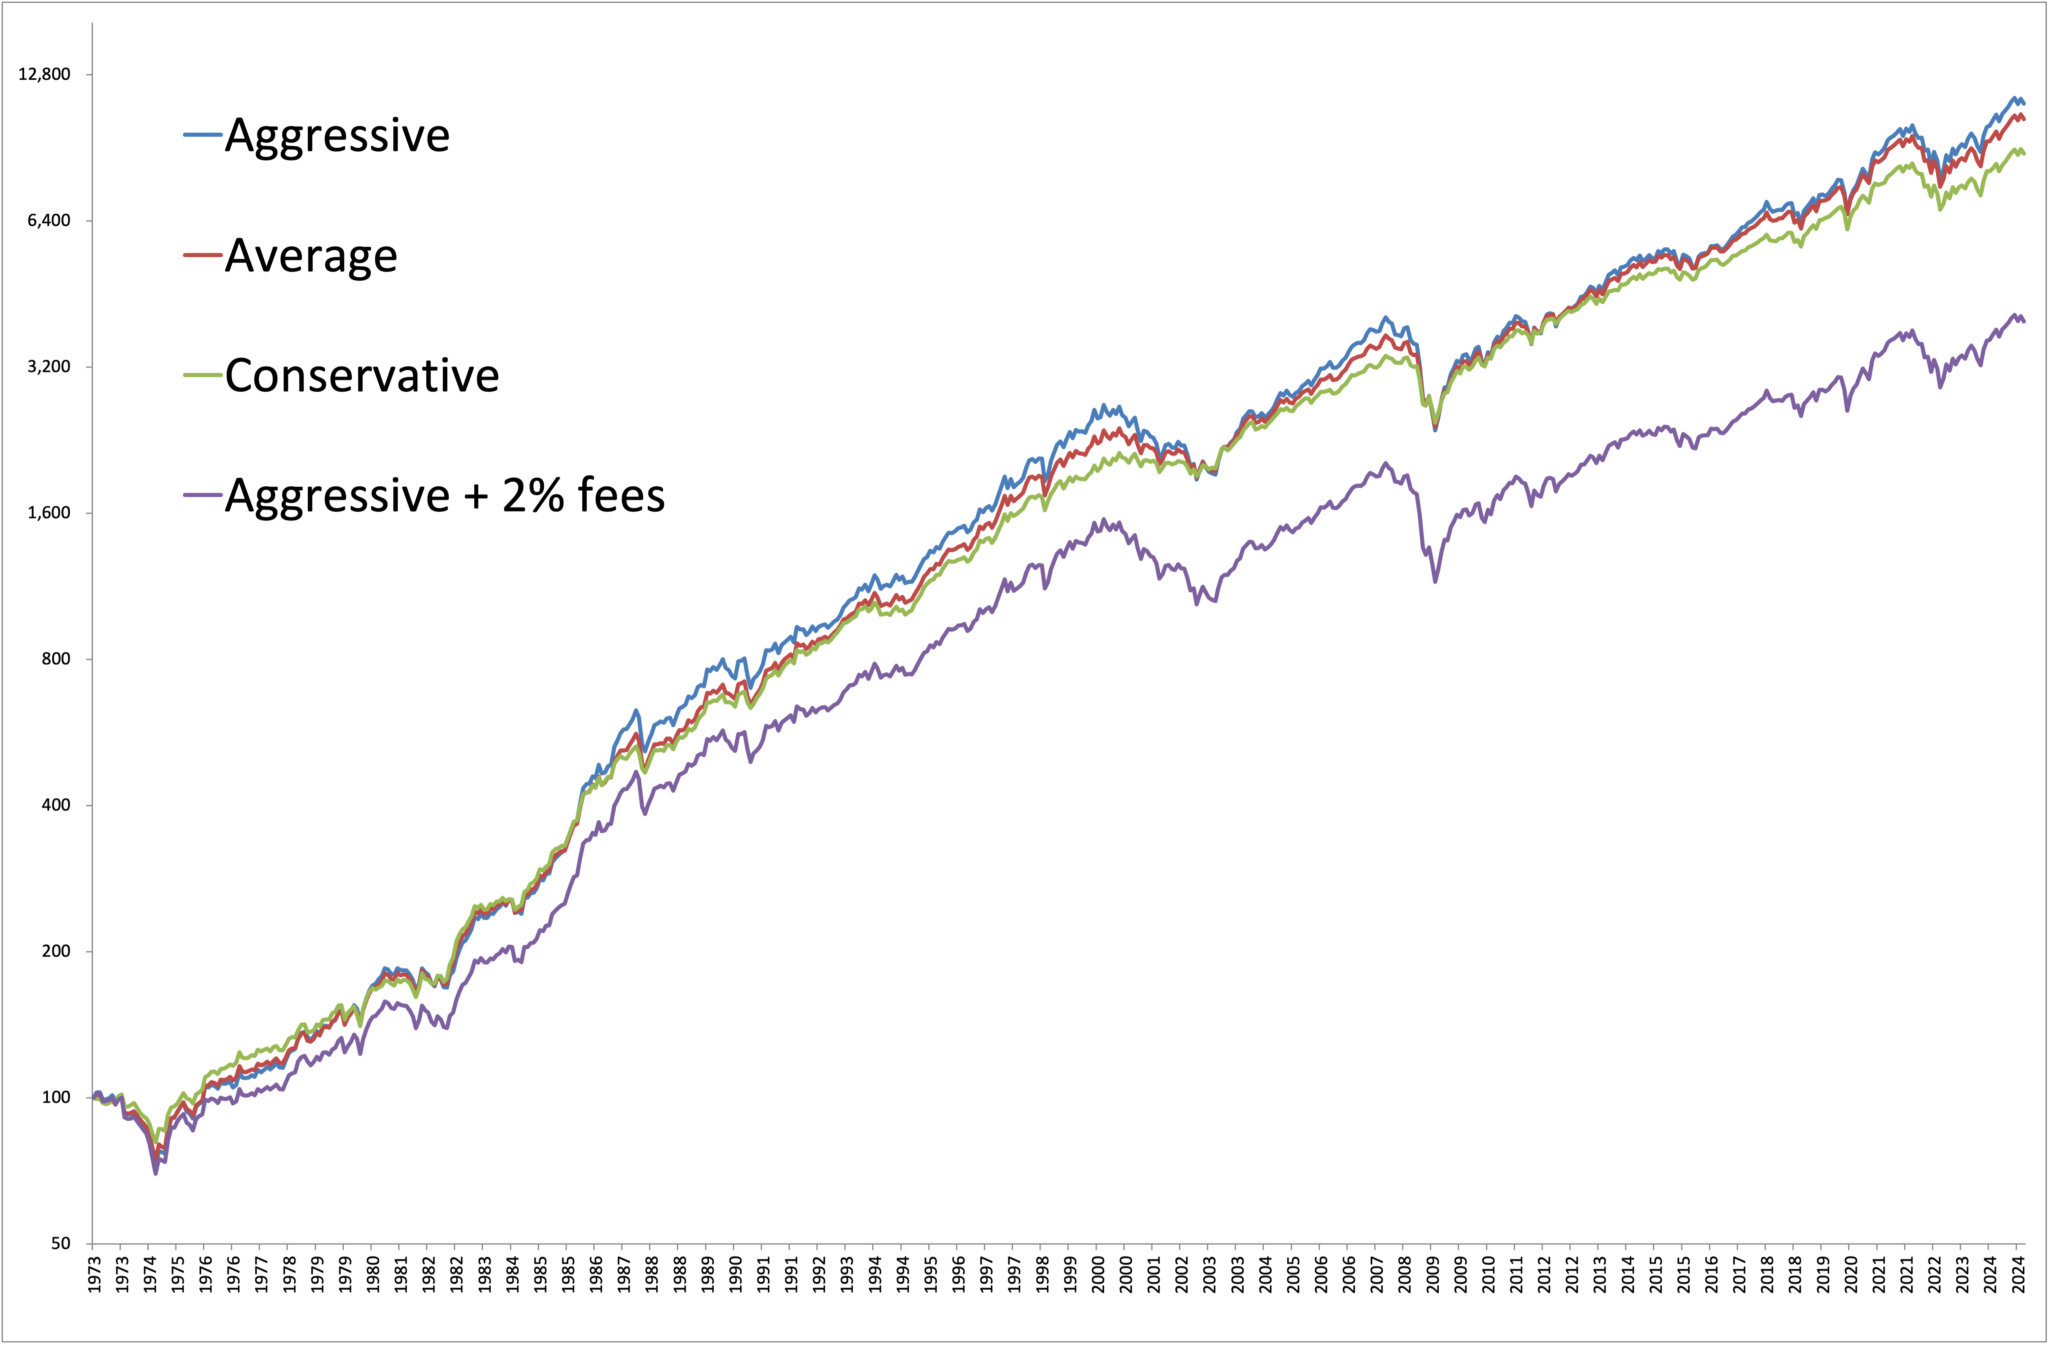
Here’s the problem. Many of these hedge fund and private equity strategies cost the end investor 2 and 20, or 2% management fees and 20% of performance. So that 10% annual gross performance gets knocked down to 6% after all of those fees.
So yes, perhaps Bridgewater and other funds do generate some alpha, the problem is that they keep it all for themselves.
Regardless, it’s good to see that you can replicate a tremendous amount of their strategy just by buying the global market portfolio with ETFs and rebalancing it once a year while avoiding huge management fees, paying extra taxes, or requiring massive minimum buy-ins.
The relevance to your portfolio
Let’s take this away from the academic and make it relevant to your money and portfolio.
As you sift through year-end articles proclaiming how to position your portfolio for a monster 2024, or more likely given a pundit’s preference for gloom and doom, news an impending big recession and crash coming… as you stress about how much money to put into gold, or oil, or emerging markets… as you lose sleep wrestling with whether U.S .stocks are too expensive… consider a more important question…
“Does it even matter?”
If the biggest pension fund and the biggest hedge fund cannot outperform basic buy and hold asset allocations, what chance do you have?
To all the pension funds and endowments out there, the offer stands – we’re happy to design a strategic asset allocation for free. We’ll save you the $1 million in base and bonus for the CalPERS CIO role. All that we ask is that just maybe, we meet once a year, rebalance, and share some beverages.