Like I wrote about the other day, I’ve really taken to podcasts. One of the recent podcasts I listened to was an interview between Tony Robbins and Tim Ferriss. I’m not that familiar with Robbins (I keep calling him Larry Robbins, the founder of the Glenview hedge fund). He is publishing a new book out next month called Master the Money Game, his first in 20 years, and first on finance. There are lots of names included in the book our readers will be familiar with (Dalio, Swensen, Bogle, etc). Anyways, Robbins seems like a truly decent human being, and I enjoyed the interview and pre-ordered the whopping 700 page book.
Anyways, what interested me was he chatted a lot about risk parity and Dalio. I’ve written a lot about risk parity on the blog in past years (a long linkfest here), and my very first post ever in 2006 was on the topic. Robbins refers to Dalios All Weather portfolio, which Bridgewater explains at length on their website – “The All-Weather-Story“. Robbins seems to be getting into the roboadvisor game with a partnership with Stronghold Financial. Their strategy is called the “All Seasons” portfolio which is definitely a hat tip to Bridgewater. The fee of 0.75% is in the middle vs the other robo-advisors (Betterment, Vanguard, Wealthfront, Liftoff, Personal Capital, etc…and Schwab rumored to be launching soon). Like most robo sites it is well designed, takes clients through a questionnaire, and makes suggested portfolio recs using ETFs.
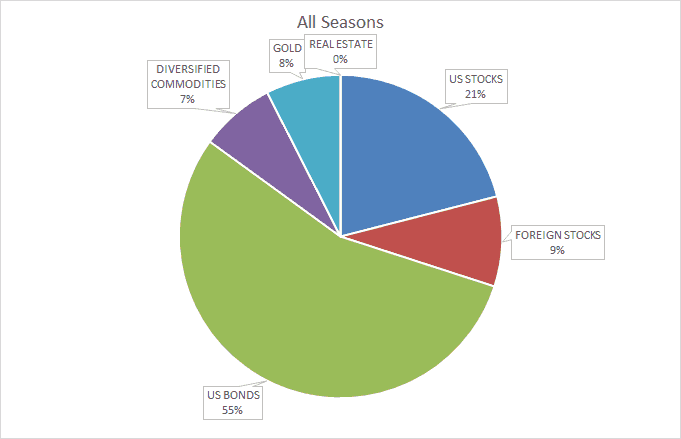
Here is the breakdown of the All Seasons allocation: Long Gov Bond 40.00% Intermediate Gov Bond 15.00% Diversified Commodity 7.50% Gold 7.50% US Large Cap 12.50% US Mid Cap 5.50% US Small Cap 3.00% International Stock 6.00% Emerging Market Stock 3.00% Total 100.00%
Here is my old risk parity portfolio from 2013. As you can see they are a little different – Robbins has more in equities, though most in the US (which you know I don’t like for the home country bias…). (I wonder if the shift in bonds was due to Bridgewater altering the strategy in 2013?)
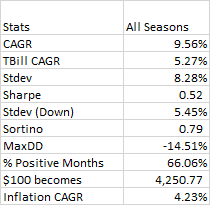
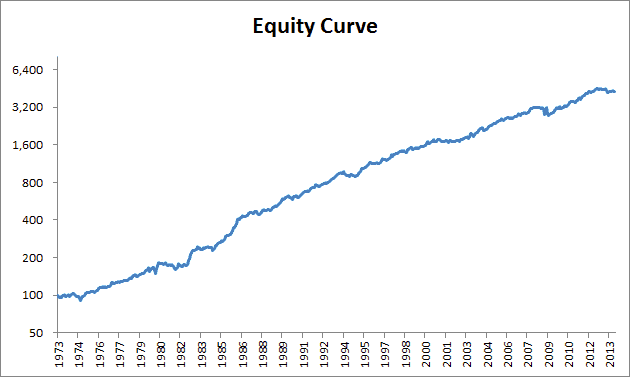
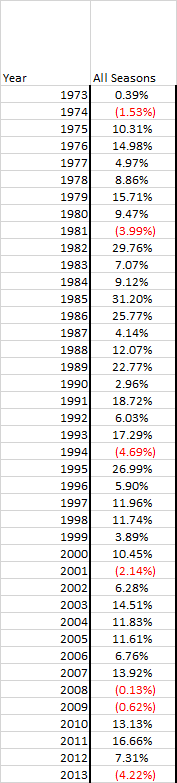
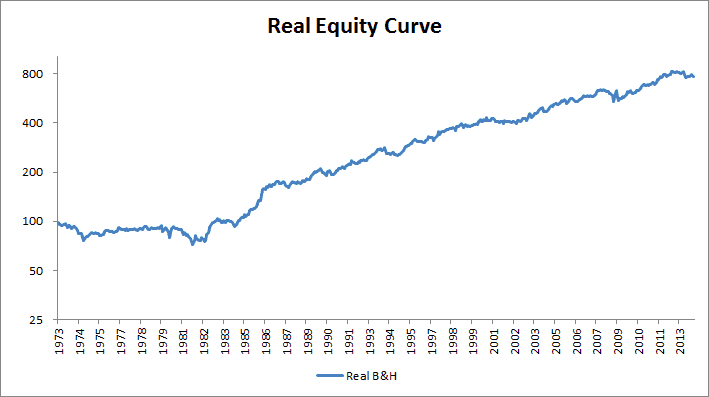
Below is performance from 1973-2013 for the All Seasons portfolio..like most risk parity portfolios that are heavy in bonds, it tends to do worse in a rising rates environment like the 1970s.
 .
.
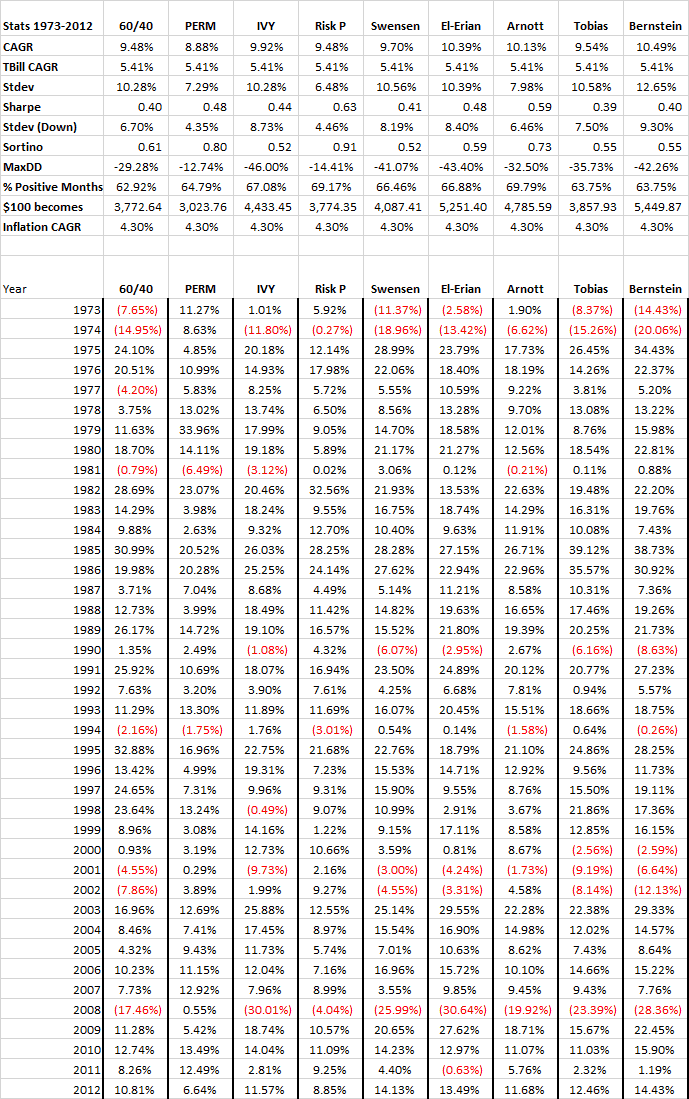
A quote from my old article last year on the topic of asset allocations models…will update the returns at year end as most of these are only through 2012…
“As you can see, they all performed pretty similarly. People spend countless hours refining their beta allocation, but for buy and hold, these allocations were all within 200 basis points of each other!
A rule of thumb we talked about in our book is that over the long term, Sharpe Ratios cluster around 0.2 for asset classes, and 0.4 – 0.6 for asset allocations. You need to be tactical or active to get above that.
What’s the takeaway? Go enjoy your summer.”