Back in 2000 I was a biomedical engineering student at Virginia (who happens to be in the College baseball World Series, go Hoos!). I was in love with genetics and all things biotech, but also spent plenty of time reading annual reports and buying and selling (often shorting) stocks. One of the classes I enrolled in outside of engineering (if you are an engineer you realize there are not a lot of those electives available) was a Security Analysis class taught by Tiger Cub John Griffin (Blue Ridge). There are a handful of old posts on the blog on the topic (old posts here and here as well as in Ivy Portfolio). I can count about 5 hedge fund managers that were in that small class alone.
The final for the class was to present a stock idea in front of the class and a panel of judges (other HF managers). Being the biotech guy of course I picked a single biotech stock long that probably round tripped up 100% down 50% over the course of the semester (Human Genome Sciences HGSI). Needless to say it was an exciting time with the genome being sequenced and all the internet craziness going on.
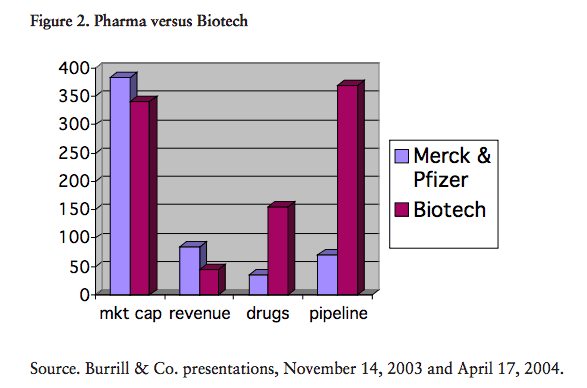
Anyways, the point of this post was I recall a stat that floated around at the time I used in my talk in general about the biotech space. Despite the bubbly-ness of the environment, long term, “would you rather own all of the entire biotech space or just one Pfizer? ” It compared # of drugs in the pipeline, R&D spend, sales, and market cap. The thesis was that for a similar market cap you could get a much better portfolio of future potential growth, albeit with less short term profits and sales.
(If anyone can find the table from 2000 and/or current I’ll update the blog post.) Updated: Here is a chart in 2008 – oddly enough it doesn’t seem like Burrill and Co exists anymore?
Let’s see how the biotech vs. Pfizer bet worked out. Below is a chart from Jan 2000-summer of 2002, and sure enough biotech got spanked hard. The (bio)tech mkt cap bubble hammered stocks (except dividend and small caps did ok). Nothing like a 70% drawdown to wash out all the weak hands.
Click to enlarge all charts.
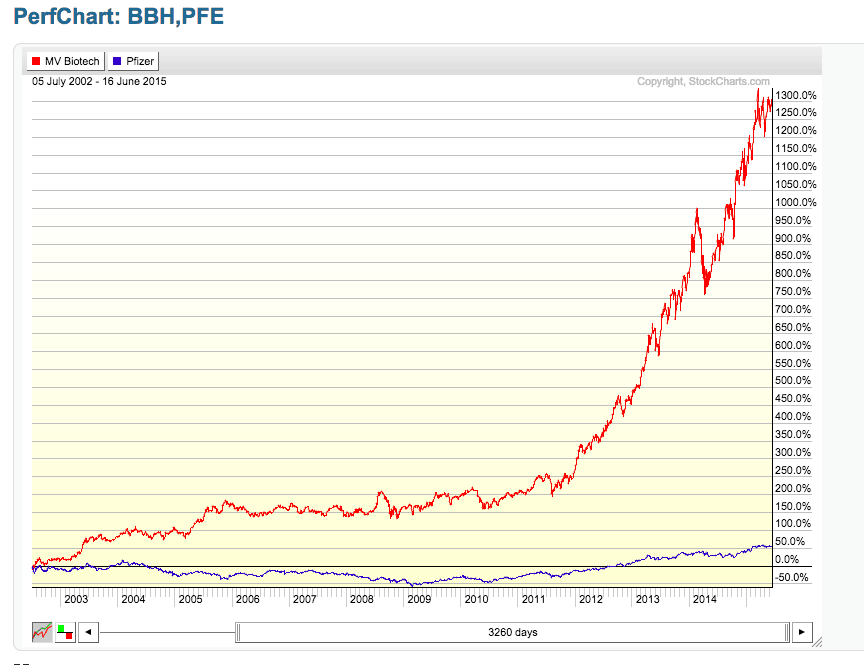
Then, as memories of the bubble faded away, look what happened the next 12 years…for those counting that is a 13 bagger compared to a half bagger. Even before the massive run it wasn’t even close. Now, to be fair some of this is just capitalism and the failures of market cap weighting, but the outperformance is striking.
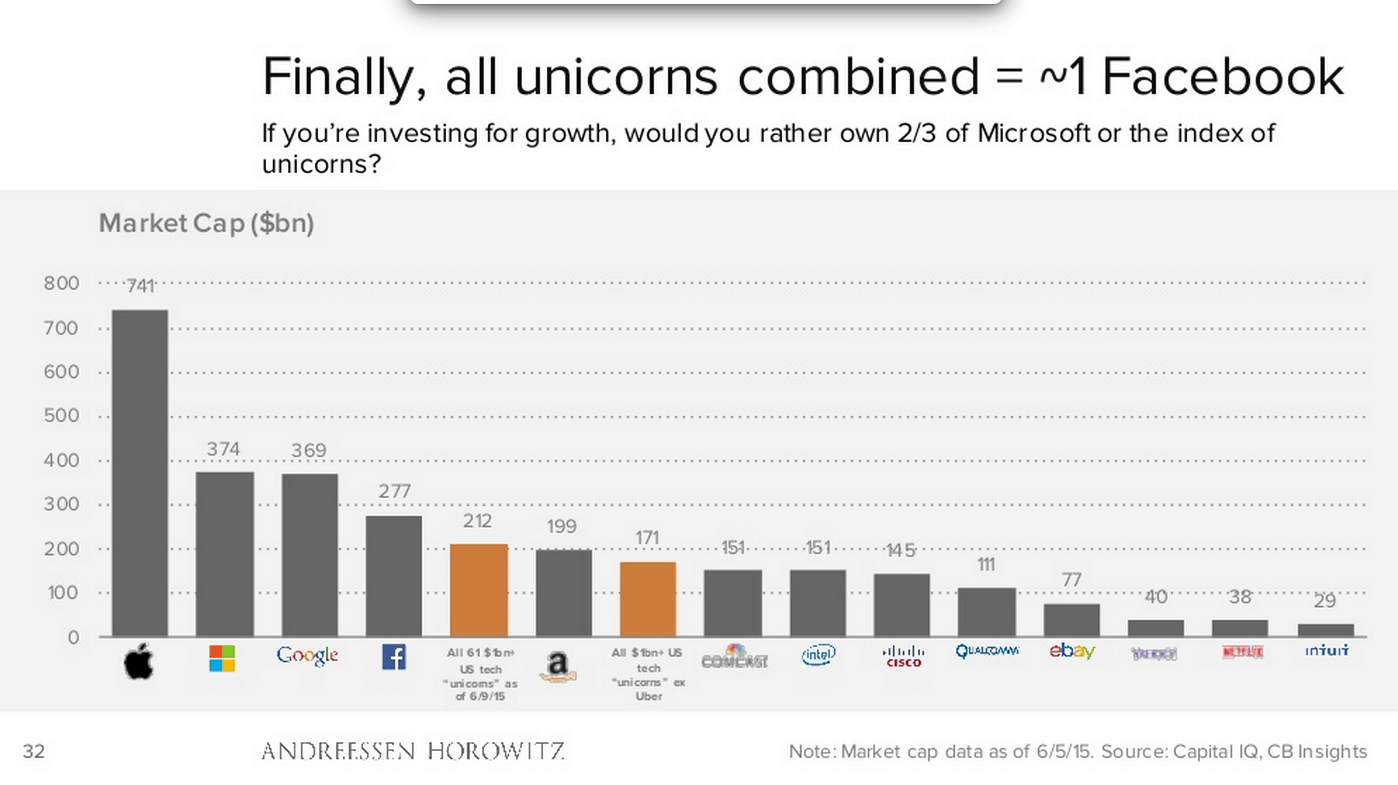
Recently the folks at a16z posted a long slideshare that included the below chart – all the unicorns (private tech stocks over $1B in valuation) are valued at less than one Facebook. Are the unicorns overvalued? Probably. will they get mauled in the next bear? Likely. But what would you rather own for the next 10-15 years? A basket of high growth small/midcap techs or just one Facebook?


