Episode #53: Radio Show: Cheapest Countries Right Now for New Dollars
![]()
![]()
![]()
![]()
![]()
Guest: Episode #53 has no guest, but is co-hosted by Jeff Remsburg.
Date Recorded: 5/16/17 | Run-Time: 1:00:41
Summary: Episode 53 is another “radio show” format. This means we tackle a handful of topics from Meb’s blog and tweets.
TOPIC 1 – VALUATIONS
3 DIFFERENT TAKES ON CURRENT VALUE PICTURE:
Meb’s recent blog post “A Bar Too High” indicated that for stocks to meet expectations over next 10 years, valuations must rise to highest they’ve ever been in history. With a current CAPE ratio of 29, that means the stock market multiple needs to INCREASE to all-time 1999 bubble highs to meet investor expectations. He thinks tepid growth is more realistic.
On the other hand, James Montier, member of the asset allocation team at the Boston-based asset manager GMO, is convinced that the US stock market is in bubble territory. However, European equities aren’t particularly cheap, either. Only emerging markets value-stocks appear vaguely attractive to him. Investors should be patient and hold a lot of cash in their portfolios in order to be able to buy when markets are correcting.
What would make the US equity market attractive again – how much would it have to correct?
To get back to our sense of fair value tomorrow, it would have to fall by more than 50%. Then we would be on average valuation, which again we estimate based on profitability going back to normal.
A third option from a reader question: “Lately there seems to be a lot of talk about CAPE measure not being as meaningful as many seem to think that it is because the very low yields on bonds and full pricing of bonds are basically changing the overall risk adjusted returns landscape. I think the point people are making is that stocks are fairly priced for current overall market conditions, despite many indicators which suggest that prices are historically high.”
Three viewpoints – how does Meb see them all? You’ll hear his take.
TOPIC 2 – INVEST IN SINGLE STOCKS AT YOUR PERIL
A new study by finance professor Hendrik Bessembinder, called “Do Stocks Outperform Treasury Bills?” found that while investing in the overall stock market makes sense, individual stocks resemble lottery tickets: A very small percentage of winning stocks have done splendidly, but when gains and losses are tallied up over their lifetimes, most stocks haven’t earned any money at all. What’s more, 58 percent of individual stocks since 1926 have failed to outperform one-month Treasury bills over their lifetimes.
Professor Bessembinder found that a mere 4 percent of the stocks in the entire market — headed by Exxon Mobil and followed by Apple, General Electric, Microsoft and IBM — accounted for all of the net market returns from 1926 through 2015. By contrast, the most common single result for an individual stock over that period was a return of nearly negative 100 percent — almost a total loss.
Given all this, what reason is there for the average retail investor to be in specific equities instead of broader sector and index ETFs?
TOPIC 3 – VOLATILITY
Here’s a chart about our current low volatility – actual U.S. stock market volatility going to back 1928 has only been lower about 3% of trading days.

How does Meb interpret this – do these low readings mean a reversion is likely? Or is it the opposite – more of a trend approach where objects in motion tend to stay in motion?
Also, how would an investor act upon this using a tail-risk hedging strategy involving puts?
There’s plenty more and a handful of rabbit holes in this radio show episode, including investor sentiment, the name of Meb’s new child, how to avoid value traps, and yes, as the title suggests, the cheapest countries in the market today.
What are they? US stocks outperformed bonds by 2.2% a year over the last 40. How much outperformance has come since 2009? All of it.US stocks outperformed bonds by 2.2% a year over the last 40. How much outperformance has come since 2009? All of it. Find out in Episode 53.
Comments or suggestions? Email us Feedback@TheMebFaberShow.com or call us to leave a voicemail at 323 834 9159
Interested in sponsoring an episode? Email Jeff at jr@cambriainvestments.com
Links from the Episode:
- Meb’s Tweets of the Week – the main link
- Meb’s Tweets of the Week – from last week specifically (reference for most of our topics)
- Meb’s blog
- 5:18 – CAPE Ratio, Why Have Thou Forsaken Me? – Faber
- 9:42 – “A Bar Too High” – Faber
- 19:12 – CAPE ratios comparing Japan and US
- 23:46 – Do Stocks Outperform Treasury Bills? – Bessembinder
- 28:16 – The Capitalism Distribution – Longboard
- 35:20 – Volatility chart
- 36:36 – Where The Black Swans Hide – Faber
- 38:05 – Bev Doolittle – Doubled Back
- 40:33 – “The 10 Best Days Myth” – Faber
- 41:45 – Pathetic Protection: The Elusive Benefits of Protective Puts – Israelov
- 41:54 – “And we talked about this in an article – lots of ways to hedge” – Faber
- 43:11 – “We have a fund that does this…”
- 50:11 – Investors Intelligence Survey – Rotblut
- 53:08 – The Great Depression: A Diary – Roth
- 53:30 – Extraordinary Popular Delusions and The Madness of Crowds
- 56:01 – “The Biggest Urban Legend in Finance” – Arnott
Transcript of Episode 53:
Welcome Message: Welcome to The Meb Faber show where the focus is on helping you grow and preserve your wealth. Join us as we discuss the craft of investing and uncover new and profitable ideas all to help you grow wealthier and wiser. Better investing starts here.
Disclaimer: Meb Faber is the co-founder and chief investment officer at Cambria Investment Management. Due to industry regulations, he will not discuss any of Cambria’s funds on this podcast. All opinions expressed by podcast participants are solely their own opinions and do not reflect the opinion of Cambria Investment Management or its affiliates. For more information, visit cambriainvestments.com.
Sponsor: Today’s podcast is sponsored by YCharts. YCharts is a web-based investing research platform that I’ve been subscribing to for years. In addition to providing overall market data, it offers investors powerful tools like stock and fund screening and charting analysis with Excel integrations. It’s actually one of the few sites that calculates both shareholder yield as well as 10-year PE ratios for stocks, two factors that are notoriously hard to find elsewhere. YChart’s platform is fast, easy to use, and comes in a fraction of the price of larger institutional platforms. Plans start at just $200 bucks a month. And if you visit go.ycharts.com/meb, you can access a free trial. And when you do, you receive up to $500 bucks off an annual subscription. That’s go.ycharts.com/med.
Meb: Hello, podcast friends. Welcome to the new Bi-weekly Radio Hour with Jeff Remsburg. Jeff, what’s up?
Jeff: What’s happening?
Meb: Maybe weekly. We’re gonna see how busy we get with this. But we’re gonna start doing our normal weekly guest chat with outside investors, people. We thought there’s so many questions and ideas to do a radio chat. It’s pretty easy. We can just come in here and BS. We may start doing a weekly. Maybe bi-weekly, we’ll see. This’s the first one.
Jeff: The second actually. This is the third one.
Meb: We’ve done a lot before, but we haven’t called it the Radio Hour yet.
Jeff: It’s not true. Our last show notes is called the Meb Faber Show Ready Hour, the Meb Faber Spin-off Episode.
Meb: Well, you know, look. I did that one from the hospital. So, I’ve been in a state of sleep deprivation. So you gonna forgive me. I don’t really remember anything from the past month.
Jeff: Yeah. Give us a baby update.
Meb: Everything’s great, Anton. Jackie, my wife, won out, so Mebane Gunnar got nixed which is why I wanted either one. She said no to both, so Anton Faber. Yeah. He’s doing great, piece of cake. I don’t know what all the commotion about. It seems easy to me.
Jeff: What’s the source of Anton, is that her literary propensity.
Meb: The etymology, is that the right word?
Jeff: Right.
Meb: It actually means handsome, warrior, entrepreneur, successful entrepreneur handsome warrior who is destined be a quarterback, maybe a center fielder. I don’t know. We’ll see what he likes.
Jeff: This is not a conversation I wanna continue on. Let’s hop on to some questions.
Meb: Me either. I’ve had enough diapers for months.
Jeff: Once again, given the whole radio show type format, we’re gonna dive in some of your Tweets of the week, some blog posts, things that have been interesting to you.
Meb: Yeah. You guys keep sending questions, by the way, feedback at the Meb Faber Show. We tried to do a voice mail for you guys to call in and leave voicemails. But, Jeff, I think we’ve gotten zero voicemails.
Jeff: Yeah. As of now, there been no messages.
Meb: You guys are too embarrassed to hear your voice on air, so we would nix that. Send us emails. Let us know. Let’s get started.
Jeff: It sounds good, all right. So the first thing is basically valuation. So, you had a few different Tweets that covered…it’s kind of like a Goldilocks situation. Your take on the current market is it seems to be that we’re overvalued, but you think that we still have some growth though somewhat anemic. James Montier came in far more pessimistic. He had some Tweets about, it would take a 50% drawdown to get the market back to fair value tomorrow.
And then we had an interesting question from a reader. I’m just gonna go ahead and read it to give everybody the flavor. He says, lately there seems to be a lot of talk about CAPE not being as meaningful as many seem to think because the very low yields on bonds and the full pricing of bonds are basically changing the overall risk-adjusted returns landscape. I think the point people are trying to make is that stocks are fairly priced for the current overall market conditions despite many indicators which suggest that prices are historically high. The thinking, I guess, is that historically bond yields being much higher than they are now attenuated equities and now pushing equities is a reflection of the very anemic long-term outlook for bonds and particularly where we are in the economic cycle today. So, just pulling back, we have three sorts of stages. Fill us in, where are we, how do you see all these?
Meb: Sorry. I fell asleep. That was a long question. I don’t know it was a question, more you just wanna talk about valuations kind of. You know, we just did a post called “CAPE Ratio, Why Have Though Forsaken Me,” or something like that. I mean, people love talking about valuations. I think one of the challenges that people almost always talk about them incorrectly, come to incorrect conclusions. Here’s my example. So we post our original White Paper on CAPE, which I think was 2012 and eventually the book in 2013 or ’14. We then said, “Hey, look. Let’s look and see how the performance has been since where we published.” And this is all public information. You can look it up. We posted tables in the book and White Paper that showed current CAPE valuations for all these countries. We tracked about 45 and then said, “What are the total returns for all these countries since then?” And it worked exactly like you would expect. We’ll post a link in the show notes where the expensive stuff did poorly. It was something like 8 or 9 of the 10 expensive countries had a negative return over this period.
Jeff: What’s the…
Meb: I said over 20, the top quartile, so the top 25%. This is about 10 countries. The 10 most expensive which happened to be, I think, countries there were over 20 valuation. Eight or nine had negative performance. The average performance of that bucket was -2%. You know, that kind of normal range of valuations which is 14 to 20, had pretty solid returns. And then the cheap stuff was 12%, right? You know, the exact way you would expect it now. Like anything, it looks like a scatter plot. So there’s outliers on the cheap stuff outliers. Greece, which we labeled Greece barf was the worst. The best was Ireland. They just crushed it. And then on the expensive side, big outliers were Colombia which I labeled, you know, Meb gets booted out of the room because when I was giving presentations in Bogota when I was trading, Colombian stock market was trading CAPE ratio of…I think in the mid-30s. You know, it had a horrible return sense. It’s been cut in half. And then the one, the big outlier, the only positive country trading above 20 at the time was the US which has done something like 80% since then. And so that -2% figure for the expensive stuff includes the US doing 80.
So you take out the US and expensive bucket got destroyed. And what most people do is they look at the US stock market only and they say, “Hey look, the US has gone from a CAPE of 20 to 30, therefore, valuations don’t work.” No, that’s exactly how valuation works, and that’s the way it’s always worked. Usually the E, their earnings doesn’t bounce around that much. It’s a lot less volatile than the P. Usually for a market to go from a CAPE of 20 to 30, what happens, the P went up 50%. And to go from 30 to 40, the P needs to go up…you know, the market go up another third. You know, a lot of people don’t understand that. They also don’t understand the flipside. So say you have a cheap market today. Let’s call it any of these Eastern European countries that we love any like. So let’s say Czech Republic, P of 10, Portugal 12, Italy at 14. You may say, “Look. I like Spain at 14, who’s been on fire.” Spain has just been crushing it this year, might be the best performing, one of the best performing stock markets in the world. Let’s call it a CAPE of 14 because it’s increased over time. People say, “Hey, that’s cheap. I’m gonna buy it.” Spain could easily get cut in half and then that just mean Spain is now a much better buy at a CAPE ratio 7. So it’s like a rubber band.
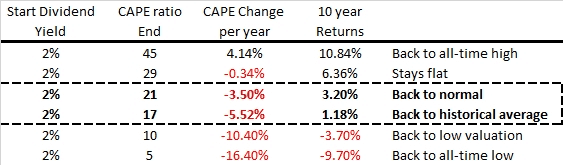
That having been said, a lot of people approach valuations the wrong way. They don’t think expensive can get more expensive and cheap can get cheaper. We talk about this a lot and so we’ve done posts where we talk about, you know, poker and blackjack and in a spectrum of possibilities. And we did a Tweet the other day where we looked at expectations. So listeners, think to yourself in your head what do you expect stocks return for the next 5-10 years? So you got a number, you can say it out loud if you want. There’s a lot of surveys lately and the surveys produce returns of stocks for ten and a half percent, roughly. There are some countries are higher some countries are lower. But mostly, it’s around ten and a half percent because that’s what stocks historically have done ballpark. You know, it’s closer to ten or nine and a half I think, high nines, real returns like six and a half in the US, internationally five. But we did a chart and we said, “Look. We use the old Bogle valuation model which has John Bogle, founder of Vanguard, has three inputs, starting dividend yield, dividend growth, change in valuation. That’s it. And you plug those numbers in historically and you get a pretty accurate predictor of future 10-year returns. And you plug those in now, 2% dividend yield in the US will give you historical earnings growth, dividend growth so 4.7% and no valuation change. That gets you to 6.7.
Problem is, you know, for valuation to settle back down to normal levels of 17, you can even say as high as 21 with inflation, that means your return to be 1-3%, so three percent better than bonds but not much. 1% not great and you’re taking on a lot of volatility and potential drawdowns. But the whole point in this article we said, for stocks to match investor expectations, so ten and a half percent a year means that valuation multiple needs to increase, and it needs to increase over the next 10 years to the highest it’s ever been in history. You know, we talk a lot about expectations. And expectations for most investors are way too high. So for stocks to exceed expectations, it means valuations need to increase higher than the highest they’ve ever been in the bubble years of 1999. And so what are the chances of that happening? I would say pretty low. It’s possible. What’s more likely to happen? I think 1-3% returns.
Jeff: Playing devil’s advocate though, let’s talk about the reader’s question. He’s talking about is the CAPE being somewhat moot in the sense of where bond yields are. So, as an analogy, you’re a frequent fan of talking about how when companies began to return more money to shareholders through buybacks then dividend yield, it was a sort of a structural change in the industry. Are we at a point right now with bond yields as they are where it’s a structural change and it affords a higher CAPE than has in the past?
Meb: A little bit but not much. So, historically CAPE has been around 17. When CAPE…or sixteen and a half or something when you have mild to low inflation of 1-3%, in this globally CAPE can get up to around 21 as an average, not 30. Yes, bonds have some impact but not that much. It’s more the fear and greed of the marketplace. For the same reason you could say, “There’s a lot of other countries in Europe that have much lower inflation and bond yields, and they traded single-digit low double-digit PE’s.” So people always make that argument. Then you say, “Well, okay, fine. What about Europe?” And they’re like, “No, Europe doesn’t count because of X,” you know, and they make the argument. I mean, in CAPE in a way are automatically incorporates bond yields already through…that’s a whole cyclically adjusted part, so it’s talking about inflation. That’s why in this chart we said, “Look. For CAPE to go back to an average of 21, mean stock returns about 3%. To go back to full term average of 17 mean stocks return 1%.”
Jeff: What do you take about Montier saying a drop of 50% for a fair market value?
Meb: I mean it takes you back down to 15. That’s happened in the past. I mean, you could go down to 80%. It’s happened in the past in the ’30s. You could have CAPE ratio of five. I mean, it’s happened in the past. I mean, look. I could think of plenty of scenarios where you could come up with a CAPE ratio of five.
Jeff: You’re speaking way too logically, no reason the pundits on CNBC hate having you on. You won’t give them sound bites.
Meb: You get about four examples on Twitter every day of people’s outrage, whatever it was, avocado toast, men rompers, whatever Trump’s saying of the day and you tell me you can’t think of a situation or evaluations could go down to five? Absolutely but on the flip side, too. Elon Musk finds that the moon is made out of diamonds instead of cheese like could you have a CAPE ratio 45, sure. We got to 90 in Japan, second largest economy in the world. As recently as the mid-2000s, it got into the 40s and 60s in India and China. So it’s totally possible. But the way the world looks right now, this is a very simple take away. Most of the listeners are hugely overweight US stocks. Simple takeaways, if you’re overweight US stocks, you’ve been given the biggest gift ever post 2009. So you’ve had US outperformance, which never happens by this much for this long. So you should be plowing money into foreign stocks. Hopefully, you read my book and started doing it. CAPE’s had awesome returns in 2013, 20 15, 16, 17. It’s printed, Czech Republic, Portugal, Russia, Italy, Poland, Brazil, Spain, Greece, Singapore, Turkey, Norway, Austria, Hungary, Egypt, and then China, Colombia. All those are actually pretty cheap. And then you have a plenty that are reasonable that hold 14 to 20 zone is totally reasonable like it’s not awful. Hitting 30 is a pretty strong yellow flashing light. Hitting 40, I see no reason to own that market, ever.
Jeff: While we’re on this another Twitter question, how do you avoid value traps when investing in the cheap countries or you do you not care as much as time will eventually make the trade work?
Meb: Is yes to both. It depends on what you’re doing. You know, if you’re setting up an equity program and all you care about is being long equities then it’s simply rebound, except the draw downs and move on. For the personality, and we’ve talked about this a million times, who’s more interested in buying the cheap stuff? We’ll talk about our bud Steve Sjuggerud talked about, which is simply buying the cheap stuff once it enters an uptrend and then he puts on trailing stops. And that’s a totally reasonable way to go about investing. Say, “Hey, look. I’m only going to buy Russia once it’s above its 200-day moving average and update it once a month. And if it falls below, I’m gonna sell it and then move on,” same thing.
You know, a lot of these countries this is…we’ve been talking about this for a long time now. I’ve been giving speeches on this since 2013. For the first few years of the speech, I said, “Look. We’re in a world. The best possible scenario is when value and trend intersect. When the cheap stuff has the momentum and it’s going up. And that’s not the way the world looked until about summer of 2016. Whether that was interest rates bottom in the US, whether it’s just who knows what. We’ll be able to know in hindsight. Foreign really started to outperform then. And it’s been on a monster tear then. But a lot of these countries still haven’t had the huge moves. So you’re still in a really cheap bucket. So I think there’s still a lot of room to run. I mean, even Jeff Gundlach, you know, just came on his Ira Sohn presentation. You know, had a double line and said “Look. My best trade idea right now as long emerging markets shored US.” And I agree. I mean, that’s a huge and very basic simple trade. They’re both an uptrend still, but one is a lot more expensive than the other.
Jeff: You evaluate the length of these trades on full economic cycles like seven to nine years, or is there a different way to look at it?
Meb: I mean, people are gonna look at it daily, weekly, monthly. You know, Morningstar looks at three-year track records usually. Yeah. I mean, valuation is a very blunt tool, takes a long time frame, you know like anything can underperform in any given year even in couple two three four years. but over time I can’t think of a better way to do it like what are you gonna do? Buy expensive countries? That’s stupid.
Jeff: I mean, I’m curious what degree of zeroing in you do You mentioned Spain earlier. It’s been on a tear. Would you have any reticence about investing in Spain given how much it’s climbed in such a short amount of time?
Meb: No. I mean again, that’s the whole point of what is your methodology So ours is we update it once a year, and anything more than that is too much. And so a couple names will come out and a couple names will go in. I mean, who knows. If you had really big time chaos, you may have more than that, but it usually is not that much turnover. And usually the turnover is the names on the periphery so like China’s cheap but it’s not as cheap as Russia. So China, you know, may move out of the cheapest bucket but not by much.
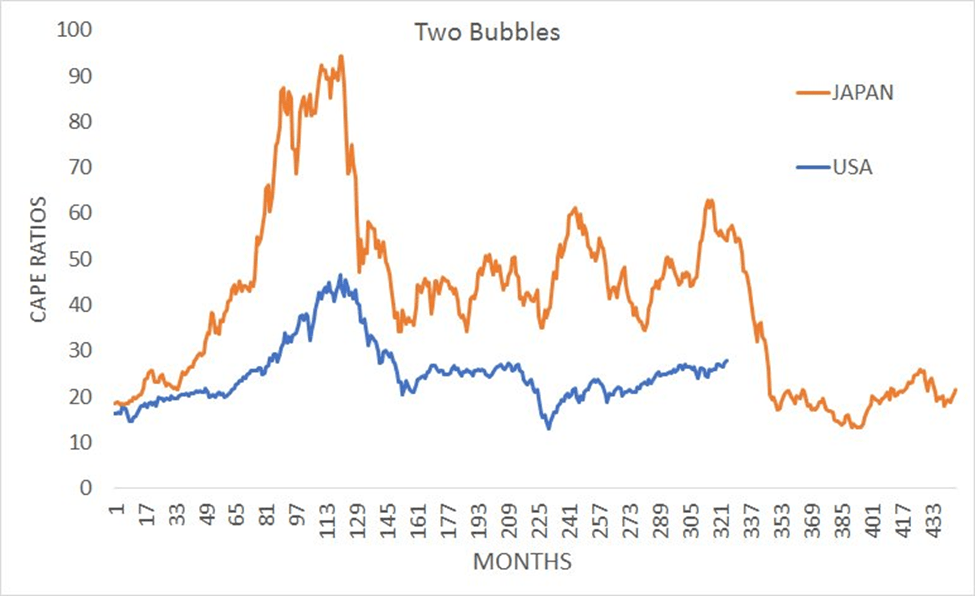
Jeff: You posted a chart about CAPE ratios comparing Japan and US, and it was four bubbles. But you mentioned that they both bottomed around 13. Where are you in Japan right now, are you liking it?
Meb: I love talking about Japan because it’s not some backwater. You know, the challenge of using CAPE with some really small countries is a lot of these countries don’t have a massive economy or stock market. So Greece, for example, or Czech Republic. You don’t have 2,000 stocks in there. You may have 20, you know. But Japan at one point was…utill very recently the world’s second largest economy. I think it’s now third after China. But at one point in the ’80s, it was the world’s largest stock market. For the older listeners will remember this. Younger won’t. So Japan went through the biggest bubble we’ve ever seen in the ’80s hit a CAPE ratio 95, had two decades terrible performance. Everyone wrote off Japan forever, zombie banks, deflation, all their problems and essentially took two decades for that to work off. It eventually bottomed at CAPE ratio of 13 a few years ago. And then what happened if you remember Japan is the best performing stock market in the world, and it’s crept back up.
I think its evaluation in the low 20s now, so not screaming cheap but not awful and then certainly better than the US. But you know, it’s just interesting because you look at it like the magnitude of a bubble. And so Japan’s again in the ’90s took two decades. The US hit value of 45 in the late ’90s. It’s weird that both of them, by the way, occurred into the decade in literally at the end of the year at the end of the decade, on like the last month. It was you know an odd piece in history. Anyway, the US picked in the late ’90s, ’99 December. And then it only took us eight years to get back to normal valuation, so it hit 17 then sailed down through and also bottomed 13 in March 2009. A lot of people probably weren’t buying that. You know, no one was saying, “Man, look how great CAPE works.” You’re buying cheap US stocks in March of 2009 because everyone thought the world was gonna end and, you know, the banking system was never going to exist. But in fact, the matter was US stocks were cheap.
Jeff: We talked about Japan. You know, they have demographic issues. We talked about the US interest rates, low interest rates, is there ever a situation in which you’re gonna reevaluate CAPE as being effective? Is there ever a paradigm shift in which you’re gonna lose as much confidence in it?
Meb: Like any good researcher, I’m open to ideas. So if someone was to come to me and say, “Hey, look. Here’s an input to your model that quantitatively could improve it or impact the efficacy of it.” I’m totally on board with that. You know, I totally foresee…I mean, we’ve learned a lot about CAPE in the ensuing years. For example, you know, a lot of other people publishing Jesse Livermore, our friends at Star Capital in Germany, you know, publishing a lot more analytics on the vagaries of MSCI’s universe. So there’s an MSCI CAPE weighted as well as investible market universe which is much more expanded. It doesn’t matter for 90% of the countries, but some of the smaller ones, for example, it does make a difference. Now, it doesn’t change the conclusion. But so Greece, for example, depending on which index you look at has a CAPE ratio of two or like -10 because of the earnings. Now, that’s one reason we don’t just use our earnings. We use four or five other long-term valuation metrics like dividend yield, cash flow, price-to-book, all those because any given market may have a structural oddity.
You know, Australia, for example, because of incentives has a higher dividend yield, you know, so things like that. So we use a valuation composite. So Greece still falls in the cheap bucket no matter what. But you learn some of these things and you incorporate them. So if someone to say, “Look. Here’s how you can incorporate demography.” I know Research Affiliates a lot about this as does GMO. And they have ways that they incorporate it into Research Affiliates paired with PIMCO has put out a lot of good research here. But I don’t have anything that’s found be particularly useful that improves upon it from econometrics time series. But we’re open to it.
Jeff: All right. Well, let me switch out of this subject move on to our second one. We’re gonna go from macro now to micro. A new study by finance professor Hendrik Bessembinder called “Do Stocks Outperform Treasury Bills” found that while investing in the overall stock market makes sense, individual stocks resemble lottery tickets. Very small percentage of winning stocks have done splendidly, but when gains and losses are tallied up over their lifetimes, most stocks haven’t earned any money at all. What’s more 58% of individual stocks since 1926 have failed to outperform one-month treasuries over their lifetimes. So they’re a little more here but let’s just jump in right now. You’re obviously not surprised by this. Meb, why would anybody knowing this continue to pick individual stocks and not just go to ETFs?
Meb: I mean, explain so much about stock investing in the past 100 years. The main draw, what makes most people salivate is the Amazon, right? Where it goes up 40,000% and people get rich. And they see that and they forget about or don’t know about the thousands of other stocks that have gone to zero. And it’s the same with the economy. You think about restaurants in your local neighborhood. How many restaurants have been around for 10 years? Probably very few. How many have turned over? I mean, we have one local spot in Manhattan Beach. This probably been 10 different restaurants in 10 years. You know, it’s capitalism. And that’s beauty. It’s that creative destruction. So there’s a couple takeaways. One is that concentration like a Bill Gates or Warren Buffett can build extreme wealth. But it has the flip side and the odds are against you. It’s kind of like the lottery ticket. You know, there’s a number of ways to protect yourself. The simplest is own everything. The good part about owning everything which is market CAPE weighted index like the S&P 500 is you were guaranteed to own Amazon. You’re guaranteed to own Exxon, and Walmart, and all these other big…McDonald’s, all these other huge winners over the years. You’re also guaranteed to own all the losers. The good news is the losers become a smaller and smaller percentage of the overall fund as they lose market cap. So it’s a basic trend falling index. And that’s…
Jeff: I would never have expected you to be advocating for market cap right now.
Meb: It is a good first step. It is a trend falling index, and most people don’t know that. So, it is a good first stop. Now, the problem with it, is it has no tether or no anchor to value. And so there’s some very simple deviations from market cap you could do, such as equal weighting, valuating on things like price-to-book or price earnings that historically have skewed you to outperform market cap weighting by a percent or two a year, right? And so the problem comes is that…and there’s so many of these multi-factor type of funds. You know, we run shareholder yield. We run some others, is that it still gives you a shotgun approach. So you may own 50, 100, 200 names out of 2,000 but hopefully, you’re owning the better ones. Now, you’re still…that’s pretty concentrated, but that’s what you have to pay for. If you own more than say 100, you’re starting to look a lot like the broad indices which you can buy these days for like five basis points at 0.05% for an index mutual fund or ETF. But these are all good things. You know, look. I think market cap weighting is a great first step. I think you can do better. The big challenge is you need to avoid paying too much. But this also describes the whole high fee which traditionally been called active industry is the hope and the dream of picking these winners. And when you do, you do have the massive outperformance, you know. It kind of goes back to the whole monkey throwing darts and everything else is that it is very enticing to think you can pick these huge winners. It’s just really hard.
Jeff: Yeah. Just to scare the readers a little bit further, I’ve got to read this. Said that a mere 4% of the stocks in the entire market headed by ExxonMobil followed by Apple, General Electric, Microsoft, and IBM. They accounted for all of the net market returns from 1926 through 2015. By contrast, the most common single stock result for an individual stock over that period was a return of nearly negative 100%
Meb: Yeah. And a lot of this goes back to our old friends, Black Star, now Longboard [SP], Eric Rendon who’s was on the show to put out the study that we cited so much called “Capitalism Distribution. JP Morgan did the study and then this professor I hope and assume he cited Longboard. But for some reason, no one would ever cite them. It used to drive me crazy because it’s kind of bad behavior not to. So I assume they did. But if they didn’t, Longboard was the first one we’d ever seen published this. And it just goes to show why stock picking so hard, you know. And it’s fun particularly when you get one right. But, it’s a really…the numbers are stacked against you.
Jeff: To what extent would you factor this into an asset allocation model where everybody’s got a little bit of a gambling bone? So would you allocate some money to single stock selection purely as sort of just a, you know, a Vegas type pool?
Meb: Look, if it keeps you interested and its fun, you wanna to put 5% of your money in it or 10%, whatever, you know. But you should assume that you’re gonna get S&P’d or worse would be my like what I would tell most people. Having seen hundreds of friends and clients that have their fun account, you know, very rarely do, you know. Here’s the challenge it also incentivizes a little bit of bad behavior. And this goes back to the classic. You know, an investor is like, “Hey, look. I’ve outperformed…” We’ll get emails like these where people are like, “Hey, why would I invest with you guys. Over the last six months, I’ve owned this, and I’ve outperformed you. Why would I hire you?” And I’m like, “Look. You keep compounding at 50%, you’ll be the next Stevie Cullen. You should keep doing what you’re doing. I have no interest in you hiring us.” But this could go on for years, right? You know, it is also, I think, a big mistake where a lot of investors will try out to advisors. I think that’s fine if they try them out from the standpoint of personality and process and how they work with them. The worst thing they can do is the performance horse race. So like, “All right. I’m gonna have two advisers and put them against each other. The one that does better wins.” Well, the irony is that you should probably flip them, you know, after two to three years. The one that’s done worse…well, let me qualify that assuming they have a sound investment approach. If they’re just out doing crazy things and you’re betting on, you know, their abilities. I have no idea, but a lot of people chase performance. And we’ve talked about this a thousand times.
Jeff: Anybody listening to this right now should have already listened to the Jason Hsu episode that just came out and which you guys talked about this, Where pretty much you’re buying into the managers after seeing them do well only to see underperformance the subsequent years when you should be buying the people who’ve done the worst and then getting the uptrend.
Meb: Yeah. So look. if you if wanna pick stocks and it keeps you interested and it’s fun more power to you. I would never recommend it to individuals or institutions for real money.
Jeff: What is the last single stock you’ve ever bought?
Meb: Oh my God. I mean, I have thousands of tales of this growing up. I think the first one I ever bought…I mean, I have a postcard. After my dad passed, we were going through all this old…he kept everything. And so there’s postcard I had written him from camp when I was, you know, like 10. It’s like “Hey, Dad, I think we should buy some Disney.” God, what were the other two?
Jeff: You were buying stocks at 10?
Meb: I was recommending them. I didn’t have any money to buy them. But we talked about it all the time. It’s funny because I then went and plotted it out, my three quote recommendations versus the market. And they crushed it. So I should have just stuck with my advice as a camper at Camp Seagull and whatever year. Like that’s how I learned. I mean, I remember buying Lucent, LU and coming home every day from internship when I was working at Lockheed and getting the newspaper and seeing what Lucent did on the day. I mean, that’s really what I sort of learned about stocks because I had nothing to do in my internship.
Jeff: We talked about this. Ironically, that’s the wrong way everybody learns via single stocks, chases, the rules, the historical returns.
Meb: And the problems you get stuck in a regime like you’ve been in the last eight years and then there’s all these Millennials who…there was some stat where Robin Hood, which is the free trading brokerage which is now a unicorn. But Robin Hood, it’s something like half of all of its investors. There’s like a million investors on Robin Hood bought Snapchat the day of the IPO, 99% of them are all underwater, right? But that’s how people learn because it’s like…if you’ve been investing US stocks last eight years. They’ve only gone one way. So it’s good in a way, but it’s also…you may not learn the correct lessons which is why you and I debate about this so much. We talk about what is the best resource? And if you’re still listening at this point, if you haven’t crashed your car or fallen asleep, I would love to hear our listeners. If you were to give a college graduate or someone interested in investing just one book, mine are excluded, so you can’t give mine. Give someone just one book, what would it be? Email us. I would love to hear because we really struggle with that. You know, trying to teach an investor the curriculum or the craft of investing, it’s kind of a scattered mishmash of resources. I don’t know of a single one.
Jeff: It’s interesting my dad, you know, brilliant guy, very smart man. And he’s owned US equities for a long time but just hadn’t really thought much of it. And I was talking to him, I don’t know, a month or two ago about investing. He was making the point, “Well, I don’t really know what to do now the markets up so high. What do I do?” I said, “Well, you know, dad there’s a world outside of the US. You know, in fact, if you look at…” I’m sort of getting him stats about the coin flip, about performance, under performance. And his takeaway was, “Wow, you just opened my eyes to a world I knew nothing about.” And I wonder how many investors out there really are so myopically focused on just the US. They’ve never learned more broadly the basics of a global marketplace.
Meb: It’s most. It’s most I talk to. You need to tell dad-Berg to listen to the podcast. Dad-Berg, if you’re listening…
Jeff: He’s too busy visiting the grandkids down in Atlanta.
Meb: I mean, look. I think it’s a big need and it’s a high hurdle. You know, look, going back to the expectations we were talking about beginning the podcast where people are assuming ten and a half percent returns. Well, most Millennials are assuming that because they’ve never known otherwise and so it’s reasonable. I’m not saying this and looking down upon people and saying, “Oh, you’re so stupid for not knowing this.” It is a very high hurdle, you know, and a multi-year process to learn this. I wish they taught personal finance in high school and college and investing, but there’s no good resource. This may be a summer project for us.
Jeff: Think about the difference. All the Millennials right now think about the difference and everyone throwing money into Snapchat versus salivating over Spain? I mean, long term. I mean, it’s night and day difference. But yeah, you have to have somebody teach those principles to begin with.
All right, let’s hop on to next topic, volatility. So you had a chart here that showed volatility dating back to 1928. Let’s see here. What does it say, actual US volatility only been lower 3% of trading days. So we are pretty quiet right now. So I’m curious, how do you interpret this? Does this mean that a reversion is likely or is it the opposite that basically we’re gonna continue with the trend of low volatility and then, more importantly, is there an action step or this is just a novel good piece of data?
Meb: So to talk about volatility a little bit, so one is that…and I kind of laughed because I tend to hate on Tony Robbins a lot. We had listened to his podcast or something a month or two ago. And he was like, “And these times of exploding volatility.” And I’m like, “What are you talking about? This is one of the least volatile markets of all time, literally of all time.” But that’s what sounds good, you know. And you get on TV and you start making these sound bites. There’s about 10 sound bites that I wanna get an intern to do like John Oliver style mashup where it’s just people on CNBC saying like the same 10 things over and over again regardless of whether they’re true or not.
Anyway, so volatility, you know, it tends to be pretty mean reverting at peaks and crisis’s right. So, 2008, 1987, the Great Depression, volatility goes crazy. We published research that shows…called “Where the Black Swans Hide” that volatility can stay low for years and typically that’s in an uptrend which is where we are now. Eight-year bull market, volatility can stay low for a very long period, in with fits and starts, right? Where volatility really increases is when the downtrend starts. I forget the exact numbers off to look it up in our research. But the volatility increases by something like a third or half when market is below its 200-day moving average, 10-month moving average versus when it’s above. And there’s a lot of behavioral and psychological reasons why when people start losing money they use a different part of their brain. You know, there’s this flight response and all these things that happen and so it’s consistent in all these markets around the world.
What are the takeaways? The one takeaway is that very high volatility is also just coincident with markets puking. So you can take a step back and it’s very simple. And low volatility is often when markets are just chugging higher like they are now in the US. It’s the main reason in my mind why trend falling works. You move from a period of uptrend which is low vol and high returns to a downtrend which high vol and low returns. And so if you just sit out those periods, you can end up compounding it at a much higher rate. So right now, like the signal is when the market rolls over. Until then, you know, it’s fine in the US. The warning side of valuations where I just posted my favorite childhood painting to Twitter which I just bought and should show up today and we’re gonna to hang in the office, is a Bev Doolittle painting called “Doubled Back.” If you’ve never seen it, it’s a picture in the snow. Bev Doolittle is a famous Western artist who does these paintings where there’s often a little bit of hidden imagery. So there’s a track with some bushes on both sides. You can see a bear track leading away. And if you don’t look closely, in the brush is a huge grizzly bear, and it’s the coolest painting. But it’s funny. I Tweeted about it yesterday. I’m pretty sure 90% of people never saw the bear, and so my joke was I’m like I’m hanging this in the office. I think it’s pretty good description of where we are right now which is valuation are high, but we’re still in an uptrend and the bear is lurking. Bear hasn’t pounced yet, right? You’re not getting mauled yet, but he’s there. So it’s kind of like the yellow flashing lights. So volatility, look, this market were in could last for years like this, you know, low decent returns uptrend but where you really wanna start to get cautious is when the market is below the long-term trend.
Jeff: Have you done any studies looking at volatility like the VIX in particular, that sort juxtaposes the average with the median? I think a lot of people kind of get confused and they think…they look at sort of the VIX right now and it’s always so low. You know, when it spikes higher it spikes big time, so it skews a t long-term averages north, all the median VIX levels probably may stay a lot lower than people realize.
Meb: You know, it can spike to 20, regularly. It can spike to 40 when stuff is really hitting the fan and that is pretty rare. And then it can spike up to, you know, the even higher when it totally hits the fan which is, you know, Great Depression, 1987, global financial crisis.
Jeff: Do you see VIX purely as a coincident indicator or is there any value in using it as a…?
Meb: I think there’s research that’s been shown that can tease out signals from VIX. You know, and volatility is not my deep expertise. From the basics is that it extremes it’s mean reverting. So when volatility is…yes, it’s coincident in many ways, but there’s a lot of people. Look. I mean, as evidenced by these dozens of nonsensical VIX funds that will lose 99% of your money faster than anything else out there. You know, there’s a lot of people that use volatility and trade it but in many ways, you know…and it goes back to the old 10-date best days myth which drives me nuts which…I just did this UCLA conference and one of the panelists referenced it. They said, “Well, the reason you can’t do any market timing is if you miss the 10 best days in the market your return gets decimated,” which is true. But they also neglect to say what happens if you miss the 10 worst days. You missed the 10 worst days, your return is massive. And actually here’s my favorite stat, if you miss both, the 10 best and worst, your return is higher than normal, and the reason being, guess where…and I think we were the first to publish this but guess where all the best and worst days happen? They happen in a downtrend, and they happen in a downtrend because simply the volatility is expanded, so people don’t know what to do. So markets whipsawing all over the place. But if you can avoid both, you compound at a higher rate because you avoid these, what we call volatility gremlins.
Jeff: A Twitter question came in asking for more information about a type of tail risk strategy which you’ve referenced some, tying into volatility here. Do you have any takeaways on more details?
Meb: Yeah. I mean, thinking about tail risks, so Good Paper AQR put out…that was critical about tail risk strategies called “Pathetic Puts.” And when you’re thinking about hedging or protecting a traditional portfolio, so let’s say US stock portfolio. You know, there’s a lot of ways to hedge. And we talked about this in an article where we said, “The stock market is risky for investors. It’s four times as risky for advisors.” And in that, we laid out why we thought, but we said there’s different ways to hedge.
The first is don’t take the risk in the first place. So if you own 100% of stocks and you wanna hedge it, own 50%, right, don’t take the risk. Second is you can diversify. You can own bonds. You can own global equities, foreign bonds, real estate commodities, all those things help to diversify. But as evidenced by 2008 and ‘9 when it hits the fan they may not. And then there’s some active strategies historically like managed futures and trend following that work great to hedge, but again none of those are guaranteed. One usually guaranteed way to hedge is buying puts because that is a direct bet on stocks going down as well as volatility increasing.
So one of the problems is most people think about that and they buy like one-month puts. And the problem with that is that you have a huge time decay and it’s very expensive. It’s like buying insurance on a house or a car, life insurance, into cost. So the best way we think to do it is to buy 12-month Puts or around that number, could be even longer and pair it with like 10-year bonds which historically already were a good hedge to stocks puking.
Jeff: But which should be rolling monthly or…?
Meb: You could roll monthly, quarterly whenever. But, we have a fund that does this. But, the takeaway is that it’s a net cost. You can see it particularly now where bond yields are low. You can see it as a bond replacement. So it’s like you’re getting bonds plus puts. Adding it all the time is gonna be a cost, right? And it’s gonna to reduce your risk and volatility and drawdown, but in good times is a cost. So the best way we think to add a tailored strategy is in the bad times. Well, you say, “Well, Meb, obviously, thank you if I could buy puts before 1987 that would have been brilliant.” More importantly, we just described a time when you could kind of predict, or historically at least forecast, when volatilities is gonna higher and return lower and that’s when you’re below the trend. So if you had a simple system such as investing in stocks, switching to bonds plus puts when the stock markets below its long-term trend historically that’s been a good time to do that. You know, it worked great in the 2000, 2003 bear market. It worked great in ’08, ’09.
But there’s other examples that are very binary that it may or may not work, 1987 is a good example. I mean, nothing would have exploded in value more than puts in 1987. And if you had the 200-day moving average or lower, you would have been in bonds and puts. And I think it’s if you had 200-day moving average or higher, you would have been in stocks. So you would had a very different outcome. And how do we been managing money in 1987, we would either be out of business or managing $100 billion by now. But the whole point is that…like so you could either own them full-time and guarantee protection. I can’t say guarantee but very, very likely that it’s gonna help, but it’s gonna be a net cost, or if you wanna do the best way probably is tactically…
Jeff: What are the metrics on this? Let’s say you put 10 for 5% your portfolio into a tail risk type strategy and the market pukes?
Meb: So if you think about tail risk, if you did it where you’re buying puts. And the way that we talk about is you’re allocating 1%. So if you own a million bucks in stocks, if you allocate 1% a month to buying puts so that would be $10 grand a month. So over 12 months, you would own a portfolio that you spend…theoretically, you could spend up to 12% but the reality is as you’re rolling those it’s really not ever a 12% cost. You know, usually, it’s much less. And so if you pair it with bonds…so let’s say you do a portfolio, ignore the structure, and you do portfolio of 10-year bonds paired with that put strategy, you end up with roughly 0% return. And if you did it with bills…I mean, it fluctuates based on the time frame. It’s anywhere from probably +2 to -2%, so it’s a net zero. So it’s not a cost, the good news. The cost of the puts are balanced out by the yield of the bonds. So it’s kind of a net-net sort of zero. There’s times when it yields higher. There’s time when it yields less. If you didn’t use bonds and use bills or just straight up cash, it would be lower. But bonds, histor- I don’t know why you wouldn’t use bonds because they’ve been historically a good hedge anyway.
So historically that’s a one to one roughly…like if the stock market did -30%, I would expect that portfolio to do 30 or vice-versa. It doesn’t really work out on the negative side but usually you have, you know, kind of more smaller losses, like if stock did 30, I wouldn’t expect that portfolio to do -30 unless it’s a period where bonds got crushed. Usually, the time when the tail risk hedging loses money is on the back end of a huge run-up. So it would be like late ’09 or late 2003 or ‘4 after it’s already gone up 50%. You know, it’s kind of like a mountain. You make sense so like…
Jeff: Yeah. I’m wondering how much does vague affect us? Let’s say that, you know, you’re buying puts, market gets a little bit more volatile and all of a sudden you’re put pricing, you know, shoots up to the roof although there’s not as much drawdown in the market. Are you suddenly taking it, you know, far worse than before?
Meb: The example almost always where this strategy loses has a big draw down, is after a huge run-up, right? Which makes sense because like let’s say 1987, think about it, so puts had an amazing performance but then as volatility settles back down as stocks eventually recover, you know, that’s where you’re on the back sloping side. So the worst idea probably would be to buy a tail risk strategy after a 50% move up in that strategy because the event has already happened. Now, what are most people gonna do? I mean, we know from experience people will probably put on a tail risk strategy at the worst possible time and vice versa. The vast majority of time it’s probably a great strategy to short, you know, not the bonds, but the puts because you’re buying protection. I mean, look. It’s my opinion. And we talked about this when I just added 10% my portfolio in this strategy. It makes sense to me to be buying protection when stocks are expensive, when volatility is low, when you have a long bear market, and then when you really wanna be adding protection, is what we call when the match has been lit, when you start to see smoke. And in my mind the signal for that is when the trend goes into a downtrend.
Jeff: What happens, just hypothetically, three more years of bull market and you’ve been buying puts for the next three years. Are you gonna get out, throw your hands up, and say forget it or you gonna double down then?
Meb: No, I’m perfectly. I mean, I approach it for me the same exact…I’ll re-balance. So it’s probably flat which is what I expect or losses it up to maybe 5% a year. Like that’s kind of meaningless to me. That’s cash.
Jeff: You’re burning through little Anton’s college fund.
Meb: Well, his college fund will probably go all into cheap CAPE stock. So it’s a good hedge. I mean it’s like my 401k. I have no choices because of the way we’ve set ours up. We can’t have Cambria funds. So, I just put it all on the Vanguard emerging markets like that’s my only like of the choices, anyway. The good news is in that scenario, the rest of the portfolio is probably doing 5, 10, 20 %. This cost is kind of meaningless. I would probably double my position when the US stock market goes into a downtrend. Because you got to remember, for me, we talked about this. My portfolios Trinity 3 which is globally diversified has a ton in foreign equities and markets like good times I would expect those markets to have great performance. And it’s kind of like the gun lock hedge. It’s like I’m by definition pretty heavy everything else and bearish on the US. And we have lots of funds and strategies. The trend falling will reduce exposure the US when it starts to go down, whether that’s 2017, 2022, 2030, who knows.
Jeff: All right. Well, moving on next subject. Let’s quickly touch on sentiment. Not a ton to talk about here, but there was a stat that you had posted where bulls in the investors intelligence survey are 58.7% and values of 60% are rare. You know, made me think of Steve Sjuggerud who was talking about sort of the cocktail party chatter indicators. One of his own personal things where he hears, hears people at the party talking about getting in the stocks. You know, he knows it’s time to get out. That was just mentioned in passing. He didn’t say that recently. But where are you right now in terms of how you’re viewing sentiment? Are you hearing anything new, are you hearing anything that makes you wanna get out?
Meb: Yeah. I mean, you start to see some silliness in general, but it’s not like full euphoria like the ’90s. You see some things over the past few years where you scratch your head and say, “Okay. That’s really stupid.” But it’s not quite like the ’90s. So there’s a post we did on the blog which is from Leuthold which reference this investors intelligence. It was a few years ago when it was also very high. And if you looked at an average of the investors intelligence over the course of a year, and then sorted them by years…this goes back to the ’60s by the way, this study. And you looked at the top 10 highest and the top 10 lowest, no surprise. The top 10 highest ambulant sort of excitement, had the lowest stock returns the next year. The lowest bullishness had the highest returns next year. So we published this a few years ago. What year did the US have crappy stock returns like 20…I can’t remember this point, 2015, was 2015?
Jeff: Oh, sounds about right.
Meb: Anyway, not good. The year prior, it was really high bullishness. At extremes it makes sense. Our favorite thing that we give in speeches is the AAII bullishness. The peak bullishness for equities was in December 1999 or January 2000. I mean, like you literally couldn’t make that up. The peak bearishness was March 2009 like it literally could not be the worst opposite way to do it. And so right now, it’s interesting because the investors intelligence is much higher than the AAII. So the AAII maybe is a little more retail. It’s interesting because if you look at their survey, it’s not crazy yet for equities. But if you look at the asset allocation of the members, is they’re overweight equities. So it’s a little bit of like I don’t know what else to do. The overweight also just goes with the flow of what the market is up to is, the markets up for 8 years. There are higher allocations just because the portfolio has drifted.
Jeff: Can you think of a US bull market that ended without going through the euphoria stage?
Meb: Yeah, probably. I mean, there’s probably a bunch. But you’d have to get a chart in front of me and talk about it.
Jeff: I’m sure is about that if you can kind of use retail sentiment?
Meb: I mean, usually look like…one of my favorite books that I’ve read recently it’s called the “Great Depression.” And it was written by a guy who’s a lawyer. It was just a diary. So he’s not an economist but reading it is such an awesome view into what was going on during that time. You read depictions of the 1920s. You read depictions of the Nifty 50 and the ’50s bull market. You know, there’s so many things that rhyme. You go back and read the bubbles of extraordinary popular delusions “The Madness of Crowds,” one of the best books ever on the topic. And there’s a few other bubble books. You know, usually, yes. That is a coincident indicator. I don’t think it’s a requirement. There’s been so much trauma for investors having gone through two huge bear markets over the past decade that…you know, I don’t know that you have to see this euphoria to get a peek. You know, you could just muddle along for 10 years at 2% returns, who knows?
Jeff: Who knows? All right, last topic then let’s wind this down. You Tweeted, US stock outperformed bonds by 2.2% a year the last 40. how much out performance has come since 2009? All of it. You know, this is a fascinating stat, but how do you interpret it in terms of an action will take away or is it simply, “Hey, too bad if you weren’t in stock since 2009,” is there anything more for us here?
Meb: Well, you know, it’s funny to watch the reactions people have to certain comments and Tweets because everyone has their own sort of bias. So you have like the equity guys who kind of flip out and you have other guys who are like, you know, the Fed is a secret society that is gonna to take over the world, you know, the Illuminati or something. And everyone has their own kind of take, but it’s just facts, right? I’m just repeating facts. And there’s been two other periods where US equities have underperformed bonds for 20 years. The data is a little more sketchy, but in the 19th century they underperformed for like 70. So there’s no guarantee that equities are gonna outperform bonds. And there’s plenty of other foreign countries that have gone equally as long where there’s no equity premium. People just assume that in the US because you had this, one of the most amazing centuries for…in particular a country and economy like ever, you know. But even then, you had these periods of 20 to 40 years where there’s essentially zilch for equities over bonds.
So there’s a lot of takeaways for that is that, you know, for very long periods asset classes and investments can go through different cycles of underperformance, outperformance, the huge bull market set the stage for bears and vice versa. You know, it’s like circle of life, Jeff. But it was just a fact. It’s a good example. So we referenced and Arnaut [SP] Study, and in it they had mentioned…I think it’s called like the biggest myth in investing or something. And they’re talking about this topic. But they said we go back to 1900 in 4 of the top 15 market gap countries went to zero, equity markets went to zero in the 20th century. And I usually only reference two which is China and Russia because, you know, communist government shut down the equity market, so you just essentially lost all your money. But there was two others and one I think was Argentina and one was maybe Egypt. And then there’s a handful of others that essentially lost all your money like Germany and Japan, you know, through hyperinflations, through wars, whatever may be.
You know, the safest thing you can do in that scenario is certainly have the globally diversified set so that “Hey, if you’re Cypress investor, invested all your money in separate stocks.” Well, tough darts, you just lost 99%. You have a global portfolio but also don’t become too wedded to one asset class, you know. If you can go 40 years, 70 years with stocks underperforming bonds like…that’s a lifetime. You know, stocks for the long run for most people like that’s measured on lifetime. That’s not measured on one or two years. So I think that’s hard for people.
Jeff: Back to your concept for Meb’s Forever Fund where you listeners can give Meb a chunk of money and he gives you a contract claiming never to return it for 40 or 50 years.
Meb: You know, we got some good responses from that, some interesting ideas. You know, one of the original ideas was is it like, hey, we’re gonna charge zero percent, but it can be a declining penalty if you withdraw. It’s gonna be a 10 year increments. So you’re gonna invest in the Forever Fund for 10 years. If you take money out in year one, you’re gonna get 10% penalty and then it declines all the way to 10 years. An interesting twist to that was like hey, not only that we’ll rebate the penalty to all the other people who stay.
Jeff: Yeah. I like the idea of the escrow account where the people stick around.
Meb: Right so they get the extra bump, so not only is there no fee, but they’re benefiting from other people’s lack of discipline. Then there’s a flipside to that which was you invest in the fund, it’s a zero percent management fee. There’s gonna 10% load upfront which you…again which just gets escrowed. And so over 10 years, you get it back at the end of 10 years. But you also get everyone else’s if they leave.
Jeff: You should publish all the investors and have it be an amazing chess game.
Meb: Public shame. The second idea I think is even better to get people to behave, right? You not only get your full return at the end no fee, you get a benefit from other people acting like idiots, what a great idea. You structure that as a mutual fund or as private? I guess it’d have to be a private fund.
Jeff: Any listeners out there like this. Write in. Let us know.
Meb: If you wanna know with $10 million, we’ll get it started. But it kind of puts your money where your mouth is. Everyone I know is like…the funniest reactions that were for people. There were such bad reactions that were the naysayers. One guy was like, “Well, how are you gonna respond to market changes?” I’m like, “Well, that’s the whole point is that you have a methodology and you stick with it.”
Jeff: All right, that’s it from me. You get anything else?
Meb: No, nothing else. We gotta a really interesting Q&A coming up next time talking about Meb’s $15 to 20 million FinTech ideas.
Jeff: You can also hear Meb rant about what to look for when applying to a new company, a new job.
Meb: Big Time. All right, that it
Jeff: That’s it. Take us out.
Meb: You guys send us emails feedback at the mebfabershow.com. Thanks for taking the time to listen. As a reminder, you can always find the show notes. We mentioned a lot of links in this one, other episodes at mebfaber.com/podcast. Please subscribe the show on iTunes. If you hate the show, if you love it, leave review. Thanks for listening friends and good investing.
Sponsor: This podcast is sponsored by the Soothe app. We all know how stressful investing in volatile markets can be. That’s why I use soothe. Soothe delivers five-star certified massage therapist to your home, office, or Hotel in as little as an hour. They bring everything you need for relaxing, spa experience without the hassle of travelling to a spa. Podcast listeners can enjoy $30 bucks to their first soothe massage with the promo code Meb. Just download the soothe app and insert the code before booking, happy relaxation.
