If you had to name the top hedge fund managers ever, Julian H. Robertson would certainly be on the list. Robertson successfully ran the Tiger Funds for many years, and an entire book is written about Robertson (Julian Robertson: A Tiger in the Land of Bulls and Bears). The Tiger Funds reached a peak of $22 billion in assets in 1998. After many years of strong outperformance, Robertson suffered large losses and while the S&P 500 index climbed 21% in 1999, Tiger declined 19%. Tiger’s largest equity holding at that time was U.S. Airways, whose troubles dragged down Tiger’s overall returns.
As a result of such missteps, Robertson closed his investment company in March 2000 and liquidated the remaining $6 billion in investments. After shutting down portfolio management, Tiger is still in operation, albeit resembling an incubator structure for young managers. Having worked at Tiger is like possessing the hedge fund gold seal of approval. Many of the Tiger progeny follow the classic value-added research based on detailed fundamental research.
Robertson earned a 77% return in ’07, and over 400% total returns since shutting down his firm in ’00. Highlights from a recent Fortune article:
“Together, before fees, the 34 funds in which Robertson has an ownership stake averaged a return of 34% in 2007. By contrast, the S&P 500 had a total return (including dividends) of 5.5% in 2007 and the Dow returned 8.9%… Only four of the Tiger-affiliated funds lost money and ten of them generated gross returns of better than 50%. Scott Booth’s Eastern Advisors fund returned a Tiger-best 125% before fees, while the worst-performing was down 15.2%.
Two of the “Tiger Seeds” with the longest and best records are Bill Hwang of Tiger Asia and Chase Coleman of Tiger Global, each of whom were in the original group of new funds to set up shop at Tiger’s office at 101 Park Avenue near Grand Central Station in midtown Manhattan. Hwang’s fund returned 55% in 2007 before fees and has a seven-year average of 40.4%. Coleman made a gross return of 91% for Tiger Global last year and his seven-year average return is 43.7%.”
Not bad. How would a cloning approach work for these funds as a group? Since I can’t imagine ever doing this again by hand, thankfully AlphaClone automates it. Free access to the Tiger Cubs clone at AlphaClone can be found here. Since we examined a method in the last post for tracking the top holdings, let’s look at a different strategy here.
Out of the 20 funds that comprise this custom fund group, what if we selected the 10 most popular holdings? The theory being, when a number of the Tiger Cubs all like a stock, maybe there is something to the story?
The current portfolio would be:
Qualcomm (QCOM)
Visa (V)
Mastercard (MA)
America Movil (AMX)
Priceline (PCLN)
Transdigm (TGM)
Snadridge Energy (SD)
SBA Communications (SBAC)
American Tower (AMT)
XTO Energy (XTO)
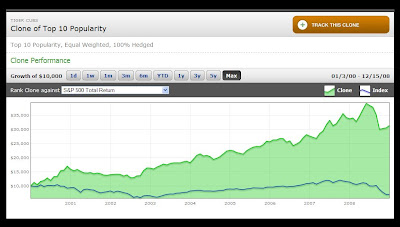
Taking the top 10 most popular stocks from 2000-12/15/2008 would have returned:
Tiger Cubs
Annualized Return: 8.2%
Volatility: 25.6%
MaxDD: -51.4%
(Max DD is maximum peak to valley drawdown, measured monthly.)
S&P 500
Annualized Return: -3.9%
Volatility: 15.6%
MaxDD: -44.1%
Source: AlphaClone
The Cubs would have outperformed the market by about 12% a year, but with more volatility and similar drawdowns. 2008 looks like a tough year for the Cubs.
Let’s say you are after pure alpha, and want to run the portfolio completely market neutral. How about hedging the portfolio 100% with a S&P500 index hedge, rebalanced quarterly?
Tiger Cubs
Annualized Return: 13.5%
Volatility: 16.1%
MaxDD: -23.9%
Those are some nice numbers where the clone outperforms the market by 17% a year (although the portfolio has high volatility and drawdowns for a market neutral portfolio). A potentially better option would be to create a custom fund group of managers that have differing styles that would pick stocks resulting in a more diversified portfolio. The good news is these simple queries can be tested in mere seconds on AlphaClone. In the next post, I’ll take a look at what DOESN’T work.


