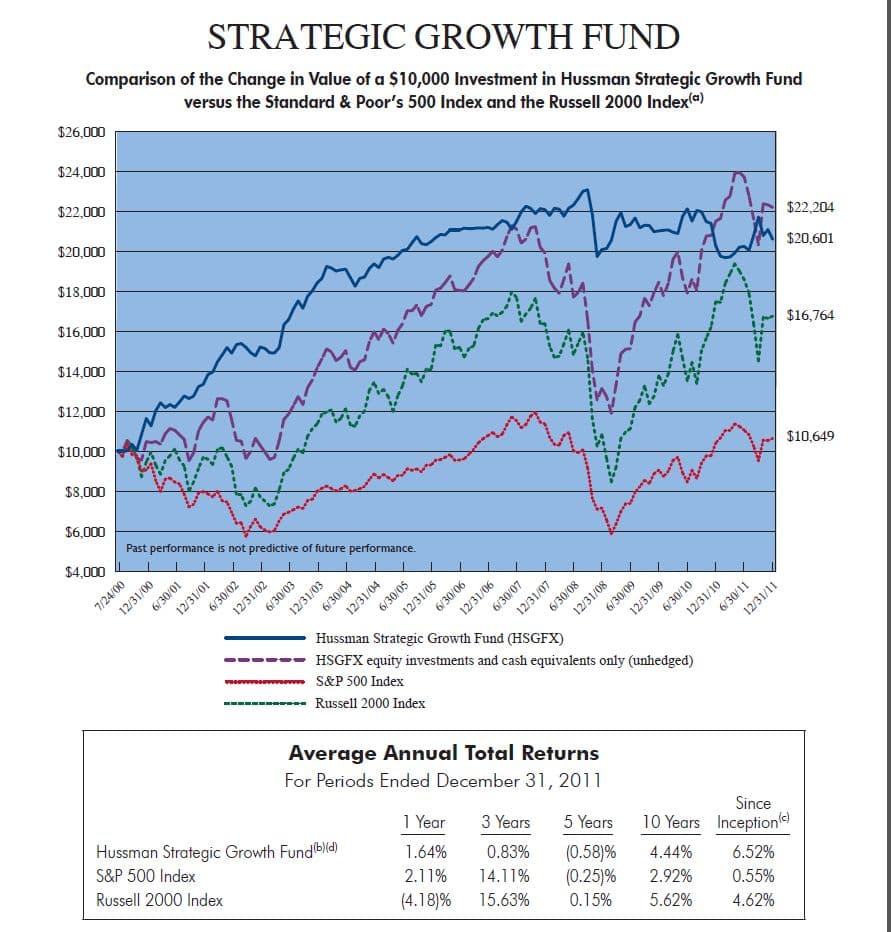
This is a really interesting semi-annual report from Hussman. In it he shows the returns of his main fund, both hedged and unhedged. The take-aways are that a) his stock picking has added a lot of value over the broad indexes and b) the hedging has added value, not on an absolute level, but a lot on a risk adjusted level by reducing volatility and drawdowns over the past decade. Click on chart to enlarge.
We have presented a lot of hedging ideas over time, the main one being a momentum, or trend, based system (A Quantitative Approach To Tactical Asset Allocation). Most of the results of a moving average system have similar properties in that the they do not increase absolute return over buy and hold, but rather reduce volatility and drawdown. (One can use other methods such as momentum/relative strength and or leverage to increase absolute returns like Relative Strength Strategies for Investing.)
Hussman’s fund is interesting, as it essentially increases equity exposure as valuations come down, and decreases exposure or hedges as valuations increase. Reminds me a lot of GMO. So in some ways it is a bit of a dynamic short volatility fund based on valuation (I know not quite the right description but works for purposes of this post). Here is an older post we did on hedging using CAPE, and found that a simple method of investing when the CAPE was less than average generates equity returns with less risk and drawdown.
Anyways, I think it is instructive to demonstrate how pairing a fund like this with a long volatility strategy would have worked since inception. So, I’m going to include the GTAA strategy from my paper here, only using the hypothetical 5 asset classes and the 10-month simple moving average. I’m also going to lop off a very conservative 2.0% for fund expenses, trading friction, etc.
(I don’t think I have to say this for long time readers, but please realize this is a hypothetical exercise that is meant to be instructive, and this is not how I manage funds, etc. In none of our funds do we use these parameters, etc. My family is also a long time HSGFX owner, none in client accounts. I have 100% of my net worth in our funds.)
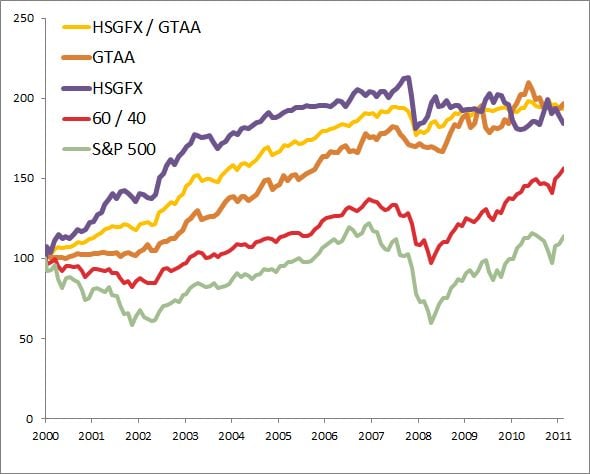
Ok, back to the simulation. Below is an equity curve of the strategies from 12/00 (Hussman inception) to end of Jan. What is interesting to note is that both strategies have delivered nice absolute and risk adjusted returns over stocks and a hypothetical 60/40 allocation. HSGFX and GTAA strategies both end up in roughly the same place, but note they have zero correlation to each other. (Also notice the 60/40 correlation to stocks, an often used argument for risk parity strategies.)
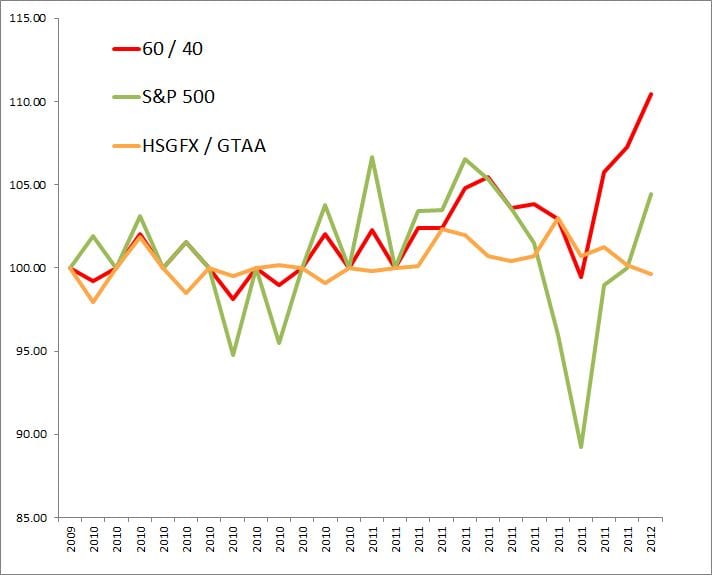
Both funds have chopped sideways in the past two years where their correlation has been -.6%. There are times where the strategies would be highly correlated (an uptrending low valuation market). I still think there is a huge need for a research piece or newsletter focused on public alternative funds. If no one gets on the ball we’re gonna have to start one here…


