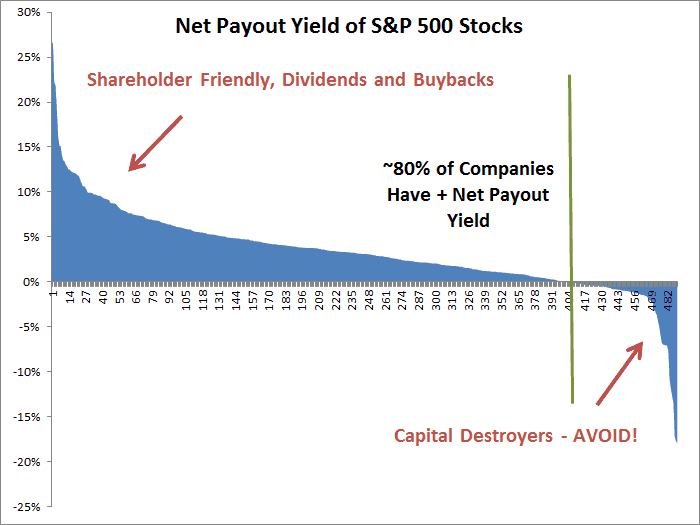
I created this chart today to see how many of the S&P 500 stocks had a positive net payout yield (dividends & net stock buybacks). Turns out it is most, nearly 80%, which is great (R2K is less around half which is not surprising due to their smaller size, etc.)
Here is the chart. I excluded the 10 worst capital destroyers as it caused the chart to scale funny. Interestingly enough, half of the 100 or so companies with a negative payout yield actually had a positive dividend, including eleven over 3%.


