This is Part II in our series, Part I can be found here: The Get Rich Portfolio
Welcome to the second installment of our new series on generating wealth, preserving it, and then looking at a real-world illustration of strategically implementing these concepts.
In our first essay, we discussed generating riches through a high-paying career, investing in public and private markets, and starting your own business.
The takeaway was there is no fast “safe” path to riches. Rather, it’s “which path is right for you?” given your temperament, financial needs, goals, and abilities.
In this second part of the series, let’s look at what happens after you’ve “made it.” In other words, you’ve amassed your wealth, and now your principle goal is preserving it.
That’s not as easy as it sounds. Also, just because you generated wealth doesn’t mean you have the skill to keep it. After all, strategies for preserving wealth can be quite different than strategies for generating wealth.
Enough introduction, let’s jump in.
From $35 Billon to Broke in Two Years
In 2012, Eike Batista had an estimated worth of more than $35 billion.
The self-made Brazilian billionaire created an empire that stretched from mining to oil to public works. Many considered him the pride of Brazil.
Barely two years later, he had lost all $35 billion…and owed another $1.2 billion to creditors.
How does this happen? How does a $35 billion portfolio evaporate practically overnight?
You could point to several poor decisions, but perhaps the biggest of all was concentration risk (and Buffett’s favorite destroyer, leverage). Batista’s wealth was overwhelmingly tied to the global commodities boom. While that investment concentration was a huge tailwind in helping Batista become rich, it eventually proved his downfall as well.
This points to a critical takeaway every investor needs to be aware of…
The portfolio that helps you get rich isn’t necessarily the portfolio that’s going to help you remain rich.
Research backs up the old saying “shirtsleeves to shirtsleeves in three generations.” 70% of wealthy families lose their wealth by the 2nd generation, and a whopping 90% by the third generation. Granted, some of that is due to high spending, addiction, bad luck, leverage, or just poor decisions. But a lot of it is how people invest their money. Can you invest in a certain way to bombproof your portfolio to minimize losses?
In this piece, let’s do what Batista should have done – spend a few minutes focusing on the “stay rich” part of the equation. If you’re an investor who has already amassed great wealth and “won the game,” what’s the right market approach that will help you keep (and potentially even grow) your wealth?
How Safe are Risk Free Treasury Bills?
When trying to engineer a “stay rich” portfolio, it makes sense to start with what the investing community refers to as the “risk-free” rate – most often, we find this as the rate of current Treasury bills.
Many investors believe T-bills to be the safest, most conservative investment available. In fact, if you look at T-bills back to 1926, they returned 3.4% per year with zero drawdown or losses. Pretty safe, right?
Not exactly.
These are nominal returns, and nominal returns are an illusion because they don’t take inflation into account. All that matters to any investor is returns after inflation, or what we call real returns. And if you measure the returns of T-bills after inflation you see a different story – unfortunately, this is a story most investors haven’t seen.
I recently asked my Twitter followers the question below…
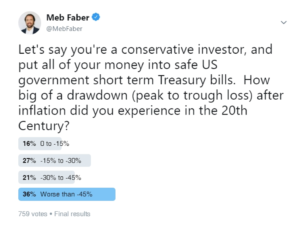
The actual real max drawdown was a whopping -49%!
But as you can see, two-thirds of those who answered got this wrong. These are very intelligent people with far greater investing experience than most, yet they seriously underestimated the losses in short-term bonds.
So, the risk-free rate isn’t risk free at all. (And by the way, I’m ignoring other global sovereign bond markets including some that produced a -100% loss.)
The original version of this post ignored what a lot of people do with their money – leave it in the bank at 0% interest…the modern-day version of stuffing it under the mattress. A full third of investors responded to a poll that they earned 0% interest on their bank deposits or “didn’t know.” You eventually lose all your assets (-97%) at an inflation clip of about 3% per year. Ouch!
What about parking your dough in other asset classes? Might real returns be safer elsewhere?
Unfortunately, no. The losses are even worse when we expand our analysis to other asset classes. Below are max real drawdowns back to 1926:
US Stocks: -79%
Foreign Stocks: -78%
10 Year US Bonds: -61%
Foreign Bonds: -78%
Gold: -85%
Ouch.
The naysayer might look at this and say “These are max drawdowns that likely played out over several years. A smart investor would have gotten out after, say, one year of bad returns.”
With that in mind, the below table highlights the worst 12-month period of real returns for each of the asset classes after annualized inflation of 2.87%. As you can see, nothing was truly “safe.”
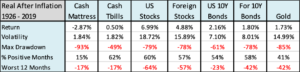
It could be reasonable to argue that people would prefer a slow erosion of wealth to a sharp loss, and in this case, T-bills do indeed look safest on these metrics. They had lower volatility, more positive months, and the lowest worst 12-month period.
However, the slower erosion of bonds might appear less painful at first glance but consider the analogy of the frog and the boiling water. As the analogy goes, if you throw a frog into a pot of boiling water, it will feel the pain and jump right out. But if you put a frog into a pot of cool water then turn on the burner, the frog will remain in the water until it boils.
The slow erosion of wealth with T-bills is a bit like the frog sitting in water that’s simmering toward a boil.
So, let’s pause and briefly recap. At this point, it’s clear that there’s no single asset that is guaranteed to preserve your wealth. The best we’ve done is a -49% decline. In the safest asset you still lost half your money at some point!
What now? Is there a way to combine assets and build a “minimum loss” portfolio?
Combing Asset Classes to Reduce Risk
Asset allocation strategies have long been known to reduce risk for a portfolio. So, what’s the worst drawdown we’ve seen with the venerated 60/40 portfolio?
60/40: -54%
We still lose over half our money. What about if we expand to the global 60/40?
Global 60/40: -46%
Ok, that’s a little bit better and shows the benefits of diversification but you still lost nearly half your money.
How about adding real assets like gold? This allocation looks like the “Global Market” (we’ll refer to it as “GAA”) portfolio we discussed in our Global Asset Allocation book (free download here).
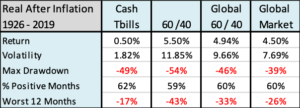
As you can see, we give up some real return, but we lower our max drawdown. So, a bit of a mixed bag.
This all points to a takeaway which I think is vastly understated by almost every investor on the planet…
Nearly every allocation (or single asset class) will likely decline by at least 30% on a real basis – and probably more – in your lifetime.
That’s a hard pill for many to swallow. But at least you have this knowledge ahead of time, which will hopefully help you anticipate it and better weather the storm.
So, What Does This Mean? Are T-Bills Still the Safest?
You might read this and think “Ok, you’ve been a real ray of sunshine and shown me that every asset class and portfolio is still susceptible to huge drawdowns. So, if it’s all bad, then I might as well start back at the beginning – T-bills seem to offer the lowest drawdowns, so that’s where I’ll park my wealth.”
I’ll propose an alternative suggestion.
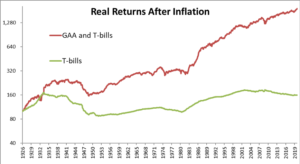
Our studies have shown that historically, an investor can combine a diversified global market portfolio (“GAA” in the chart below) with some cash to produce an outcome with similar loss levels as T-bills, yet greater returns.
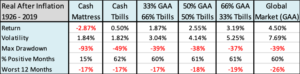
This approach enables an investor to engineer a strategy that offers comparable loss levels of T-bills, yet while generating an additional two plus percentage points of return per year. Or, perhaps framing the return as “yield” would make more sense as a comparison.
At a minimum, the “GAA” part of the equation offers some protection from the catastrophic losses Batista’s incurred when concentrating all his wealth in just one asset class
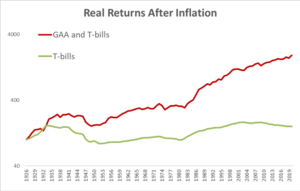
Below we chart the T-bills vs. 66% GAA and 33% T-bills combo. As you can see, there is a little more volatility with the GAA/T-bills, but well worth it for much higher returns over time.
If you zoom out and only use yearly values, the volatility looks even lower than the monthly values…
Of course, this is a philosophical departure for many. My friend Dan Egan at Betterment has spoken to this topic recently and my perspective has evolved here too. Many conservative investors keep their safe money in a savings account that earns T-bill like returns. But is that really the safest place for it? History would suggest that investing across a broad global portfolio with some cash has been a safer allocation than T-bills alone.
Now, as to the threat to your wealth posed by that high-spending child and your derelict spouse, well, that’s another problem…
We conclude our three-part series with the final segment on how I put both parts of these portfolios, Get Rich and Stay Rich, into one cohesive portfolio with my own assets and investments.
