Episode #241: Doug Ramsey, The Leuthold Group “By Our Interpretation, We’re There, I Do Think It’s Time To Be Rotating Away From Large Cap Growth”

![]()
![]()
![]()
![]()
![]()
Guest: Doug Ramsey is Chief Investment Officer of The Leuthold Group, and Co-Portfolio Manager of the Leuthold Core Investment Fund and the Leuthold Global Fund. In addition to his CIO and PM responsibilities, he maintains the firm’s proprietary Major Trend Index, and is the lead writer for the The Leuthold Group’s highly regarded institutional research pieces.
Date Recorded: 7/22/2020 | Run-Time: 1:02:46
Summary: In today’s episode, we’re talking markets. We jump right in with a walk through of Leuthold’s sober 10-year market forecast. We talk about valuation spreads between growth and value, and Leuthold’s thinking about how to be positioned based on takeaways from their research.
We get into thoughts on the US dollar, commodities, the opportunity in foreign markets, and the fallout in earnings power from the recent downturn.
Comments or suggestions? Email us Feedback@TheMebFaberShow.com or call us to leave a voicemail at 323 834 9159
Interested in sponsoring an episode? Email Justin at jb@cambriainvestments.com
Links from the Episode:
- 0:40 – Intro
- 1:37 – Welcome back to our guest, Doug Ramsey
- 3:00 – An update on what Doug has been doing since the last time he was on the show
- 4:35 – The Myths of Inflation and Investing (Leuthold)
- 8:00 – Forecast over the next 10 years
- 8:11 – Most recent Green Book
- 13:01 – Leuthold’s take on the market today
- 15:32 – Value and growth
- 20:16 – Thoughts on negative yielding bonds in the US
- 24:10 – Everyone Loves a Winner (Leuthold)
- 24:40 – Outlook for foreign markets
- 29:41 – How the dollar may impact markets
- 36:08 – Precious metals and crypto
- 38:00 – Long term performance of stocks and bonds, and defining long-term
- 41:05 – 2019 Yale Endowment Report
- 44:44 – How the pandemic is impacting strategy
- 48:42 – The Coppock Curve
- 55:50 – Markets and elections
- 1:00:44 – Learn more: leutholdgroup.com, funds.leutholdgroup.com
- Additional Charts from Leuthold
Transcript of Episode 241:
Welcome Message: Welcome to the “Meb Faber Show,” where the focus is on helping you grow and preserve your wealth. Join us as we discuss the craft of investing and uncover new and profitable ideas, all to help you grow wealthier and wiser. Better investing starts here.
Disclaimer: Meb Faber is the co-founder and chief investment officer at Cambria Investment Management. Due to industry regulations, he will not discuss any of Cambria’s funds on this podcast. All opinions expressed by podcast participants are solely their own opinions and do not reflect the opinion of Cambria Investment Management or its affiliates. For more information, visit cambriainvestments.com.
Meb: Welcome, podcast listeners. We got another amazing show for you today. We’re welcoming back our guest. He’s chief investment officer of The Leuthold Group, Co-Portfolio Manager of the Leuthold Core Investment Fund and the Luther Global Fund. In addition to those duties, he maintains the firm’s proprietary major trend index and is the lead writer for The Leuthold Group’s highly regarded institutional research pieces and the “Green Book,” which is perhaps my single favourite monthly research piece out there.
In today’s episode, we’re talking markets. We jump right in with a walkthrough of Leuthold’s 10-year market forecast for stocks. We talk about valuation spreads between growth and value, Leuthold’s thinking about how to be positioned based on takeaways from their in-house research. We get into thoughts on the U.S. dollar, commodities, the opportunity in foreign markets, and the fallout in earnings power from the most recent drawdown, this and much more. Please enjoy this episode with Leuthold’s Doug Ramsey. Doug, welcome to the show.
Doug: Thanks, Meb. Great to be with you.
Meb: Great to have you back. The last episode we did was three years ago. Time flies, crazy. Not a lot has happened in the intervening three years, I imagine. But you look like you’re sheltering place nicely. Where in the world do we find you today?
Doug: Down in our offices in downtown Minneapolis. A handful of us have been coming in on a regular basis. It’s either that or I’m gonna be letting out the dog at home every 10, 15 minutes. So I like my digs here and have all my technology. So I’ve been in most of the day since, I guess, what kicked it off. Looking back, it was sports-related. It’s when the NBA suspended its season, that’s when the whole COVID crisis got real.
Meb: Yeah, I say the only benefit of this pandemic is that my college, University of Virginia, which saw the finals in your town, gets to remain national champions for two years now. That’s the only benefit. But looking forward to hopefully some sports concluding. Well, I’m in my mom’s basement in Colorado. This is not the background. This is a local bookstore, always endearing to go home because you have a lot. It’s like a time capsule, I’m drinking my iced coffee out of a Pac-Man glass from the ’80s, and there’s “Star Wars” and “Captain America” too. So it’s a lot of fun.
All right, let’s talk markets. Last time we had you on, it was actually a really interesting kind of beginning, and we wrapped for an hour. And, listeners, we’ll add the link in the show notes, listen to that one first. But we started off chatting U.S. stocks, which we’ll probably do again right now. But you had an interesting comment because you guys do a lot of valuation work. We talked about you guys use something like 30 valuation inputs or different measures of valuation. But you also said, “You know what, there’s a chance that U.S. stocks could just keep ripping right up, they could hit 3,400.” And if you look at pre-corona, I think they almost ticked 3,400 before everything fell apart this year. But maybe walk us through what’s been going on in the past couple years, and then we’ll start talking about today and what’s going on in the future.
Doug: Meb, I’m glad you remember that. I wish we played that observation more aggressively than we did. But we’ve got a tool here, the Major Trend Index that Steve Leuthold started to build as a retail broker, actually, in the early 1960s, the Major Trend Index. I took over that tool in 2012. By the way, Steve started out as a technician. Most of the initial pieces of the Major Trend Index were technical in nature, and then as he became the market strategist at Piper Jaffray, and, of course, the inflationary spiral post during and after the Vietnam War, did a lot of work on the relationship between interest rates, inflation, and PE multiples. In fact, put out a book that, I think, is still considered a classic, “The Myths of Inflation and Investing” in 1981.
So the Major Trend Index became much more well-rounded in terms of valuations, economic inputs, sentiment, a lot of technical measures, again, which was sort of the original thrust of the work. By and large, it’s held us in pretty good stead. And just as a brief background, I’ve been at Leuthold about 15 years. I was a Leuthold research client for 15 years before coming on board. In any rate there was a difficult patch with the Major Trend Index in the late 1990s. I remember that well because I was working on mid-cap and small-cap value accounts, difficult time for that.
And then, more recently, I would say I’d have to go back and look at it exactly. But, I mean, intellectually and in sync with the Major Trend Index, I’ve really been cautious since early 2018. We started to cut equity exposure in our tactical funds. We’ve got the latitude to shift net equity exposure between 30% and 70%. We were upper 60s coming into 2018. And if you remember, there were a couple of noted value investors who are not known for chasing bubbles that talked about a melt-up in January of ’18. And things were just getting silly both from a valuation perspective and a sentiment perspective. And that was also the year that we were slated to shrink the Fed balance sheet. So we began to take down equity exposure January 25th of 2018.
I guess, for some reason, I remember the well-timed decisions and just forget the less well-timed ones. That’s sort of like the defensive back, no memory, no conscience, sort of mentality you have to have as a portfolio manager. But more or less, I’ll freely admit, been very cautious on stocks. And maybe the theme of that caution hasn’t always been the same, other than a valuation overlay over the last two and a half years from late January 2018 onward. And we’ve had plenty of asset allocation shifts. I mean, currently, we’re neutral equities, more or less, within that 30% to 70% band. I think large-cap U.S. stocks are very overvalued. That being said, our long equities within Leuthold are more of a multi-cap style. So our own long equity exposure doesn’t look as rich as the S&P 500 and certainly the NASDAQ 100 due to me. That’s where we stand.
And I’m really struck, we were very cautious, maybe not necessarily for the right reason, we had no idea that COVID was going to explode the way that it did. But I wrote, I think, in the February “Green Book” that based on valuations and based on a couple of different shorter-term sentiment indicators that it was probably the worst entry point that I’d seen for stocks in the last 20 years. And then, lo and behold, something else comes along. But, you know, the point is, valuations, obviously, are not a timing tool, but they are a risk management tool for what we’re trying to do on these technical accounts.
So when I hear that old saw that you can’t time the market using valuations, I mean, I agree with that. I’m just struck that too many people are trying to be Stan Druckenmiller here and trying to make a lot of money in what they recognise as a bubble. They certainly tried to do in ’99 and 2000, with difficult results in most cases.
Meb: So there’s been a lot of discussion and echoes about analogs between the late ’90s, and I’ll let you kind of get to those in a second. But you guys had a nice piece in your recent “Green Book,” which is probably my favourite monthly read every month. And you kind of let in by poking and teasing a large hedge fund, and Davos said, “We’re at the end of the boom-bust cycle,” which is, like, probably the most untimely, and just poorly timed comment in the history of markets, because a month later, you have the pandemic take hold.
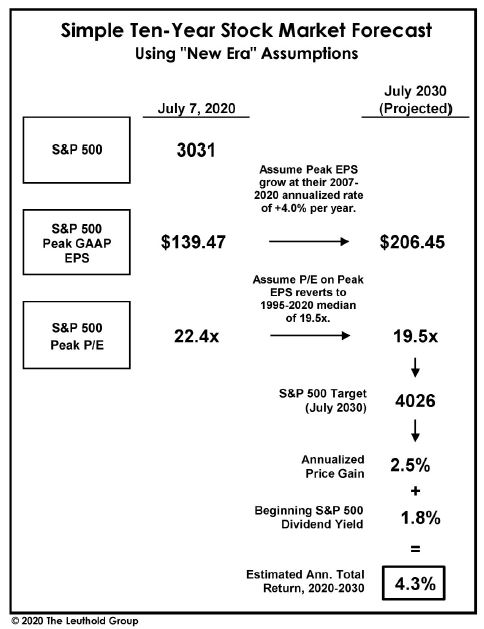
And then they went on to say that U.S. stocks are gonna have negative returns going forward. You guys walk through a simple 10-year market forecast. Maybe you could kind of tell us what conclusion of that was. Is it double digits? Is it negative? Is it zero?
Doug: What I did here, Meb, was, the issue is to what valuations are you going to revert over a long-term period, and people typically use 10 years. And then what sustainable earnings growth? So I said, “Look, let’s take the earnings growth from peak to peak of the last cycle.” So the earnings peak from mid-2007 up until the earnings peak of the middle of last year. And we like to use gap earnings. There’s just a lot of funny business going on with earnings generally, but there’s less of it going on with gap than operating. And by the way, if I do this exercise with operating, I get about the same results.
But earnings grew at 4% per annum from mid-2007 to the end of 2019. So that was the earnings peak, the fourth quarter number through the fourth quarter of ’19. It was 139.47, that’s gonna stand as the peak year, I think, for a while. But at any rate, 4% per annum, that benefited from margins going up a little bit more than one percentage point over 13 years. So if you grow the 139.47 gap earnings number at a 4% rate over the next 10 years, you get earnings of around 206 bucks. Now, this is where I was friendly with respect to the historical numbers. I conceded that, look, we’ve had a very low inflation and interest rate period over the last 25 years or so.
And I sort of look at the beginning of 1995 as a breakout into a higher valuation range than everything that had been observed historically. I mean, in terms of the dividend yield breaking significantly below 2.7%. The PE broke above 20, price-to-book broke above 2 and a half, just a lot of things broke out at that time. So I’m saying, “Look, what if we revert to the median of this higher valuation error that we’ve seen over the last 25 years?” So I’m sort of conceding a little bit of the ground to the bulls here and not saying, “Boy, we need to consider the 70-some years of market history prior to that or even longer as some people think.”
At any rate, if we grow earnings as rapidly as we did, which was not that rapid at all, I mean 4% versus a 6% historical growth rate for S&P 500 gap earnings. And then if we revert to the S&P 500 PE on peak earnings that we’ve seen over the last 25 years, these sort of new era valuations, that number is 19.5. Well, today we’re about 23 and a half today on the close of July 22nd. That would get you…so you’re talking about marking down multiples to 19 and a half. That gets you an S&P 500 price target 10 years out in July of 2030 of a little over 4,000. I mean, there are strategists this year that think that the S&P 500 might go to 4,000, 10 years early, just to put that in perspective.
But if something that were to happen, you’re looking at an annualised price gain in the S&P of 2.5%. And as far as the dividend contribution, just assuming that dividends contribute annually what the current yield is, which is 1.8%. So that would get to…it was 4.3% as of month-end in June, and we’re up another 130 points or 4% on the S&P 500. So let me just chunk in that number here. We closed it on the S&P at 3,276, it’s gonna be a little under 4%.
Meb: Yeah, well, that’s the thing with valuation, you know, if you take CAPE ratio, it gives you the same number. Like you said, if you were to use a full history lower valuation, which would usually imply higher inflationary times, it takes you lower, but it’s the same general ballpark. It’s not minus 5 and it’s not plus 15, it’s low single-digit returns, which is hard for a lot of people to get excited about.
One of the things that you guys do talk about, though, a lot and you referenced it, hinted at it when you’re talking about multi-cap, is that most people when they just talk about the stock market, they think about market-cap-weighted S&P. But in reality, it’s a market of stocks. There’s small-cap, there’s mid-cap, there’s large-cap. If you’re Trump, you selectively tweet about the Dow or NASDAQ, whichever is doing best, which you guys had to report.
What are some of the differences look like today between the size styles? Sometimes they look similar, sometimes they’re massive premiums and discounts. What’s kind of the world look like any opportunities within the U.S. market?
Doug: Well, the worst numbers by far that we see are for the S&P 500 cap-weighted. Now if you move to sort of the medium, large-cap stock, I mean, then you’re reducing the impact of those 10 stocks that are equal to…I can’t remember what number. Really, recently, it’s been the top 10 versus the bottom 490. So if you mitigate that impact by looking at medians, you’re still on all the key measures. And we like to look at normalised PE, we use a five-year smoothing of earnings. Robert Shiller, who likes the 10-year inflation-adjusted, we use a 5-year. Medium PE, price to cash flow, price-to-book, and price-to-sales. We’re still in the top two deciles on all of those measures. But the median stock has tended to be more range-bound, so it’s priced like it was in the late 1990s.
But remember that the median stocks since September got so expensive during that bifurcated market in the late ’90s, also didn’t decline by nearly as much. So I think that’s what could happen here. Now, interestingly, even despite this massive rebound in mid and small-caps, those numbers are still by and large… And this is a shorter history here. Over the last 25 years, there are still, by and large, in the bottom third of their valuation ranges. So the valuation profile for mid and small look more attractive. And you could argue, I mean, with the economic difficulties we’re facing, maybe that’s not unjustified. I mean, they’re less well-capitalised, they are less well diversified in terms of business lines.
And then, of course, we’ve made a big deal and others have as well that specifically in that small-cap space, more than a third of the constituents are losing money on a 12-month trailing basis. And that was true coming into the downturn.
Meb: So there’s the size and there’s a lot of cross kind of correlation between style, where you talk about growth and value, two traditional metrics that people love to talk about. And it’s been interesting to watch this summer, which is usually kind of a sleepy time in markets, but not in 2020, where every day where you have the small-cap value versus small-cap growth, the spreads between daily performance will be 1, 2, 3, 4 percentage points. I mean, just massive differences. And I think at one point in Q1 you add small-cap value down by like half. Are you guys seeing any opportunities, anything interesting between growth and value, and including size as well, any thoughts there?
Doug: We like to look at valuation spreads between growth and value and, I guess, just valuation spreads across the market. I’d give Mike Goldstein and Empirical Research a lot of credit for doing that. Just looking at the sort of price-to-book and PE spreads as a signal of the opportunity for leaning away from momentum and growth and what’s working into value. And by our interpretation, we’re there. I do think it’s time to be rotating away from large-cap growth.
Large-cap growth, and we’ve never really subscribed to the Fed model thinking in terms of a lower rate justifying a higher PE for the market overall. I mean, it’s clear that rates have come lower because sustainable economic growth and sustainable earnings growth have come down. And if you do a simple dividend discount model or discounted cash flow model, if the drop… And, Meb, I’m sure you’ve worked to do this math or others have discussed this. If the discount rate for the cash flows drops the same amount as the growth rate in cash flows, then there’s no change in valuation. That’s true for the market as a whole, but not for specific sectors within the market.
And I wish…I’m not sure how we would have played this, quite frankly, within our equity accounts, and neither did we anticipate that the 10-year bond yield was gonna go down to 60 basis points. What we found is that… And, again, this would have been better to have recognized when 10-year bond yields were 10% instead of about a 20th of that level. But there’s almost like a logarithmic effect on growth stock valuations, and especially like those low beta stocks of which many are now technology stocks. But tech, the secular growers within tech, and also within healthcare, I mean, they all make up this sort of broad, low vol area, and they’ve really become a levered play on the bond market.
So, what we found, I mean, this is just simple statistical relationship we found, is that the drop in rates, let’s say, from 6% to 3%, a halving of interest rates. I mean, really, the same thing happened with respect to relative valuations on these low vol and large-cap growth stocks when you went from 1.2% to 60 basis points on the 10-year, all of a sudden that growth got that much more valuable with another halving of interest rates. So in other words, the 60 basis points dropped from 120 to 60 basis points had the same impact on valuation is going from 10 to 5 earlier on a couple of decades ago, or from 6 to 3. So it’s really remarkable.
And the question is, I mean, could the 10-year bond yield go from 60 basis points or thereabouts to 30 basis points and goose these valuations even more? I mean, I don’t know what kind of economy are we gonna have if we go down to 30 basis points or lower on the 10-year. That’s an impact that we really didn’t think about, in part because we didn’t entertain the discount rate might come this low. But in terms of how we manage our long equities here, in a simplistic fashion, we’re more growth and momentum at the industry group level.
So we’ve been in some of these winning groups like the semiconductors, we’ve been in the managed healthcare stocks for over a decade. We’ve been in biotech more recently. These have worked out well, but then we’ve become value investors within the attractive groups, and that’s hurt. We should have, rather than trying to buy the cheaper stocks in the attractive groups, we should have just bought the most expensive category killer, so to speak, and we’d be sitting better. Although our equities all in considering their multi-cap with a little bit of value bias on the stock-picking, I think, they’ve done okay.
Meb: So you touched on the bond yields, you got a hat on. So you got your forecasting hat on, you have to put a probability, and this is more happy hour coffee talk than holding you to it. But you gotta put a probability. Do you think within, say, the next five years…let’s say the next three years, we’re averaging a talk every three years on the podcast. Next 3 years, do we see negative-yielding sovereign 10-year bonds in the U.S?
Doug: I don’t think so in the U.S. I just think it’d be devastating not only to our banks. It’d be having some positive yield here has been the only thing that’s kept some of those big European banks alive. So I just don’t think it happens here. I mean, as an aside, people talk about the wealth effect, you know, and all the great things the Fed has done in expanding the balance sheet and goosing the money supply. Well, if you’re in your 70s and 80s, living in Florida with some social security income, and maybe not a huge portfolio, it’s absolutely inappropriate to be loaded up on equities.
So your treasury bill income… I don’t mess around with munis, I know there are better deals to be had. And it looks like we’re gonna backstop the muni market. Didn’t see that coming to the extent that it’s come about. But let’s say a good slug of your net worth is in treasury bills. Well, you’ve just taken a 95% income hit from where we were just a couple of years ago, just 2 and a half years ago. And it’s just interesting that no one really comments on… And, of course, that was the talk of Fed policy, expanding this wealth gap. And I think that’s true, but on the other hand, the income flows, the safe income flows you can derive from any portfolio have never been lower.
And I’ll give you just one quick example. We might have talked about this 3 years ago, Meb, that over history if you go back to 1880, a 60/40 portfolio S&P and 10-year bonds has delivered an 8% return. Hence you had the 8% return assumption incorporated by so many pensions, they could back it up and say, “Hey, I’ve got 140 years of evidence to back up that assumption.” The issue is the median portfolio yield, so 60% of the S&P 500 dividend yield and 40% of the 10-year bond yield, that’s your portfolio yield, total yield. The median is 4%. Today, we’re at 1.4%.
So are you telling me that from already high valuations on the S&P 500, second highest in history compared to 99 and 2000 will be the highest. And the highest bond prices in all of recorded history, you’re telling me that somehow capital appreciation is gonna make up for this yield that is less than half of what it’s been historically? There’s just no way it’s gonna happen. So hence you see what’s going out in your state with CalSTRS, or CalPERS, levering up parts of its portfolio to meet an expected return assumption. Not recommended for those at home.
Meb: Well, now that you’ve depressed all the listeners, particularly the retirees, go make another drink if you’re listening to this, and you’re all bummed out, we’ll still be here. The CalSTRS, just to noodle them a little bit and tease them, they also had like one of the worst ill-timed redemptions, where they redeemed all their tail risk funds in like Q1 before the pandemic. It was, like, quite possibly the worst timing. But anyway, they seem to be moving to the last remaining savior for a lot of the pension funds, or at least the one they’re believing in, which seems to be private equity and leveraged buyouts. I think that’s gonna be a big stressor for governments over the next decade will be a lot of these obligations and pension funds. So we’ll see.
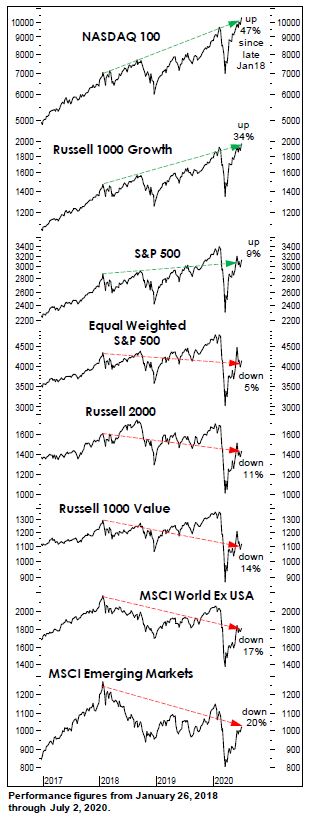
You guys had a couple of other interesting charts in the recent “Green Book.” One was just how different market returns have been. And the example you used since 2018, which is almost when you last joined us, and the clear winner has been NASDAQ. And this is outdated a little bit, but let’s call it up 50%. And then it just goes like a stair-step down, it goes NASDAQ, Russell Growth, S&P, Equal-Weighted S&P, Russell Value, World ex-US, and then emerging markets, of course, coming in last.
Do you see anything changing? We had kind of this crazy 2020. And if you just blinked and woke up today, from the starting point of January wouldn’t seem that odd with the returns where they are, but the path certainly has been. What about some of these other markets, particularly foreign stocks, anything else on your radar as what’s looking attractive or something to stay away from?
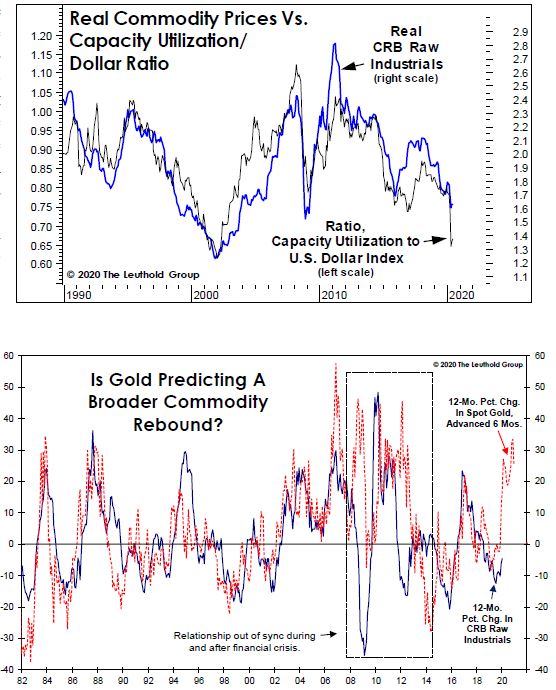
Doug: I do like the value in foreign markets, emerging markets. Now, they’re not nearly as cheap as they were at the bottom in early 2016 during that global commodity price meltdown. But they’re certainly, you know, at about half the multiple, whether you’re looking at like a normalised PE, which we like to use, 13, 14 versus 27 in the U.S. Rest of the developed world, I mean, Europe and Japan, again, a normalised PE. And by the way, I know that you’ve had a lot of success with an approach based on sort of a Shiller PE at the country level.
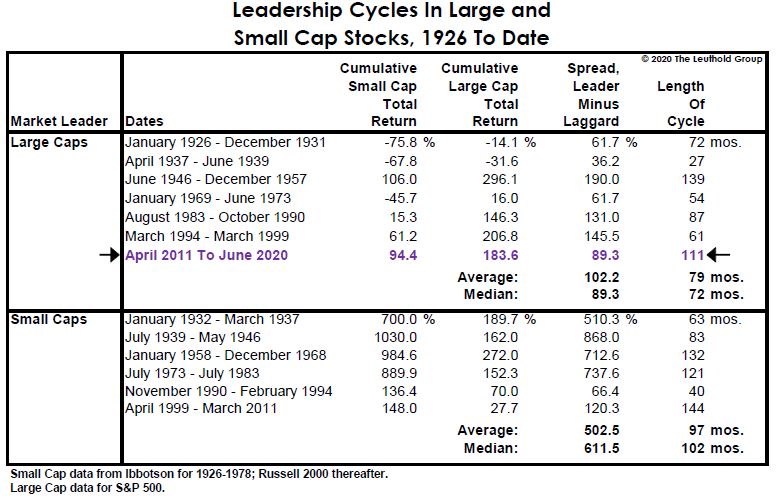
But at any rate, I do think, historically, there has been… I mean, a market event like this, a bear market, and particularly one associated with the recession induces leadership changes. And it’s just hard for me to believe that with a 13-year run in large-cap growth is the place to be that we’re gonna launch a new bull market without having rotated in anything, like small caps, like foreign stocks, emerging markets. But, again, you could have made this valuation case beginning four or five years ago and just have lumps of coal for having made that observation.
I think the interesting thing is all this focus on the liquidity and this liquidity flood, by the way… I know we started to do extraordinary things in March. But I mean, think back, I sort of think the beginning of this crisis, in a way, was back in mid-September, and now it just seems like a trivial event in light of everything that’s unfolded. But remember, when we had those difficulties in the overnight repo market, Meb, back in mid-September, I mean, that is when the Fed put any stop to shrinking that balance sheet. They suspended some of the bank reserve data actually that we like to watch immediately in the wake of that. So who knows what was going on?
And by the way, I’m sure this is a book, you’re familiar with “Reminiscences of a Stock Operator,” a book that’s coming up on its 100th anniversary of publication. It’s a fictionalised autobiography of the great trader Jesse Livermore. He would say that when things started to seize up at the money post, that was called the money post back then, that’s when he would start to rein in his longs. It’s interesting because looking back at performance since the Fed intervened 10 months ago in the overnight repo market, flooding the system with liquidity, all the money has really just gone into the NASDAQ stocks.
I’ll just give you a couple of stats because I ran them this morning. Since mid-September of last year NASDAQ 100, of course, is on top, 37.3% large-cap growth, that’s the Russell 1,000 Growth up 26%. S&P is up 8.4. S&P Equal-Weighted down 2.6. Russell 1,000 Value down 8.8. Russell Small-Cap Value down 19. It’s incredible when you have this liquidity flood, you’d think, “Oh, liquidity floats all boats.” No, the experience is the opposite. The same thing happened in late ’99. There were a lot of fears about what was gonna go on with the change of the calendar to 2000. So the Fed… Interestingly enough, it was the same action, going into the overnight repo market to flood the system with liquidity.
Well, it didn’t help all stocks, that’s when the bifurcation, which was already extreme, went into hyperdrive. And we’ve seen that not just with the repo, but also with the extraordinary actions undertaken since March, but that has left some great values here. And if we get through this thing, small-cap investors, small-cap value investors, and I think foreign investors will be pretty happy. The latter, in part, because, I think, the dollar is gonna continue to decline. And that will be a catalyst just in terms of currency translation for people who finally pony up, step up to the trough on those undervalued foreign stocks.
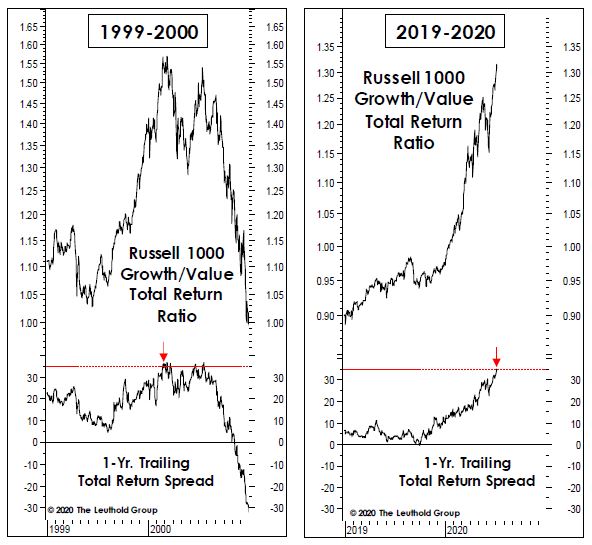
Meb: Well, we’re waiting and value investors, if anything, have to learn to be patient. Certainly the late ’90s is a great example. You guys have a nice chart in the beginning that shows the growth to value total return ratio, and you’re hitting a trailing total return spread that is a similar level that we saw in the late ’90s. And there were some other macro considerations that I think people preceded in 2019, there’s the yield curve, which everyone loves to talk about. Obviously, it wasn’t forecasting a pandemic, but it has historically been one that’s been interesting to talk about with regards to macro shifts and changes.
You mentioned the dollar, and the last few days in particular, or maybe even the last few weeks, the dollar has been pretty weak. And on the flip side, you’ve seen strength in an area that invites a lot of emotions and opinions, which is precious metals. That’s an area that, I think, silver was up 6% today and yesterday if I have my numbers roughly correct. Expand on your idea about the dollar. Why do you think that that is something that may end this long bull run it’s been having? And then, also, if you guys have any thoughts on precious metals, love to hear those too.
Doug: Clearly the policy response in the U.S., even though the argument would be that I believe in much of this, I mean, it’s still a system that really rewards innovation. The demographics here are better in terms of the fertility rate, and also some net immigration, although that slowed down. I mean, what I’m getting there is the labor force growth demographics. The labor force, which is demographics, are better than most of the rest of the developed world and actually better than much of the emerging world. I think you can spin that in favor of why the U.S. should have a evaluation premium.
But at the same time, I mean, with all those benefits, we’re seeing still…I don’t know if the word… We’ve been far more aggressive in terms of monetary and fiscal stimulus. I think that is going…at current valuations in our capital markets, foreign investors will take notice and mark down the value of the dollar. And the precious metals are taking note and they were acting well, even when the dollar was relatively firm. I mean, we bought our gold position, it’s now 5% of the core fund was back in the second quarter, I think, of 2018. Well, the dollar was firm for almost a couple of more years, but gold, by and large, acted well during that period, which we took as sort of a tell that, hey, maybe there’s something good underneath the surface going on here.
But something just in terms of, you know, as you mentioned, sort of an emotional asset, there are no cash flows, makes it very hard to value. But there was something that caught my eye out of…and this is a couple of decades ago. You may remember the market analyst Paul McCrae Montgomery wrote a piece…well, he wrote a weekly piece for… Boy, it was over four decades. Paul is probably the most creative market analyst that I can think of just in terms of the breadth of things that he came up with.
And Paul, by the way, and he was very open about this, was bipolar. So a lot of his work had to do with emotional extremes. Like, for instance, the “Time Magazine” sentiment indicator, that was Paul’s work. He went back and got every weekly cover of “Time Magazine” and investigated that as a contrary indicator when the “Time Magazine” cover related to something financial. It was incredible work. But this particular piece on gold, and he actually applied this to silver as well, I thought…it really resonated with me in terms of a valuation measure.
And that’s that Paul would look at the amount of gold required to buy a median-priced existing home. And the rationale is that, well, a house is really a relatively fixed basket of commodities, of lumber, of copper, certainly, there’s some silver involved. But it also contains equity capital, your down payment, and debt as well. So there’s a lot going for it in terms of that being some yardstick of value. So you would track the number of ounces of gold needed to buy a median existing home.
And I’ve got the chart back 50 years, Paul had this thing going back to the 1890s. And just very nicely mean-reverting, even when gold prices were fixed there for a long period. And I really hadn’t been focused on this until more recently. But I mean, the median price of an existing home has really shut up. And the latest month it was just shy of $300,000. So it would take with gold at about 1850, 160 ounces, roughly, to by the median-priced existing home.
So it’s on the high side, but it’s not yet into what would be considered overvalued territory. And by the way, you got down to where gold was…only 90 ounces of gold, excuse me, were required to buy the median existing house price. And that coincided with the low in housing prices in late 2011. So at that time…and this is remarkable, I guess I wasn’t all that focused on this. But in late 2011, the median existing house cost $155,000. So you’ve almost doubled. I mean, that’s pretty incredible. I mean, we think of the housing recovery as being nothing spectacular relative to the stock market recovery. But nonetheless, you’ve nearly doubled that existing house price in less than 10 years.
Well, if we go back and match the valuation extremes on this simple measure… And it’s better with a chart, Meb. You can tell him a chart guy as we’re going through this. The extremes in gold in both early 1980 and August of 2011 were made when they cost only 90 ounces of gold to buy the median existing home. And if that happens again, and assuming our median existing home price is flat here, we’ll hit 3,300 on gold. I think that’s pretty likely in the next three to five years.
Silver, on the same basis, and again, looks better when I have the chart in front of me. But if silver were to move to the same valuation extreme it hit in 1980 and again in April 2011, silver would go to $90. But I certainly expect it’s gonna take up the old peak of 50 we made back in April of 2011.
Meb: We have some momentum strategies, and despite the equity romping and stomping you’ve had since the bottom in March, the majority of the portfolio is still tilted towards bonds, precious metals, and smattering of sectors like tech and healthcare, but is an interesting looking portfolio. But it’s also interesting to me because the younger generation…and this is very subjective, so who knows? The infatuation, the Robin Hood crowd hasn’t…at least I could be wrong, got the animal spirits about precious metals, like, prior generations.
But at the same time, there’s entire countries like China and India, where precious metals play a huge role. And so it tends to be a very global commodity and one that certainly historically has done a good job often when things aren’t doing that great in stocks. So it will be fun to watch, that’s for sure. I have a soft spot in my heart for the numismatists, I can never say that word, in coin and gold bugs out there. I did a Twitter post today, which I need to follow-up on a poll asking people if they owned any precious metals, and it was as an investments was about 50:50. So I’m gonna follow that up with stocks, bonds, real estate, everything else, see where it slots in. But I’m guessing…I’d be curious to see if more people own cryptocurrencies or precious metals, I’m not sure.
Doug: And, you know, I’m surprised in the last couple of months that crypto hasn’t acted better. And I’ve not spent a whole lot of time studying, but I mean, you’re right. That in a way, I’m channeling Dennis Gartman here, Dennis used to talk about, well, we’re long gold and euro terms or something like that. So we’re starting to watch the S&P 500 in gold terms, and in silver terms, and in Bitcoin terms. And I mean, the rebound looks very different in terms of alternative measures of money. The S&P is still way below the highs it made. I mean, not just earlier this year relative to gold and silver, but both metals have dramatically outperformed the S&P 500 since 2000. So has the money supply, by the way.
Meb: There was, at one point in March, a lot of investors love to complain about strategies or assets that underperform over a quarter, a month, a year, or even a few years. And often they love to do it with us with our funds on any period. And, you know, I’ll often respond and say, “Well, what’s a reasonable timeframe that you think an asset class or a strategy needs in order to be effective demonstration of it outperforming?” And people come up with all sorts of different answers. But the point that I try to make is that at one point in March, I think it had been something like almost 40 years where the long bond in the U.S. and U.S. stocks had essentially identical performance.
And to me, there seems like there’s no more widely held belief in all of investing, and you can chime in as you see fit, than stocks outperform bonds over the long term. And I think they do, but I think what most people think when they think in terms of long-term is like a couple of years, maybe three. But when you start to talk in terms of decades, not just 10, but 40, I think that’s hard for people to get their hands around.
Doug: It is, and then… I mean, that relative comparison also clouds judgment. I mean, if you look at like the old Fed model, the Fed model showed stocks to be very overvalued in the summer and fall of 1982. I mean, that’s been the best time in the last 50 years. Well, you could say this fall of 1974, but that’s considered the beginning of the secular bull market. Well, the Fed model sure didn’t pick it up. Well, the problem is that both assets were very cheap. And now you have a situation where I’d argue both assets are very expensive. And, again, it gets back to that retirement dilemma.
And it’s very interesting, just sort of the narrative economics, so to speak, that you see with some of the TV pundits. I mean, what I’m noticing is a lot of very young well-spoken strategists for some of the white-shoe wealth management firms, these are firms that manage serious money for families that don’t need to be chasing the S&P 500 under any circumstance, let alone one in which the S&P 500 is priced where it is. And it’d be refreshing to see one just step back in an arm’s length and say, “Look, this is the dilemma that we’ve been put in, in terms of the lack of portfolio income and just trying to generate a steady stream off of the asset prices we’ve been given.”
And it’s just pretty remarkable that instead it just seems to be well-wordsmithed momentum chasing is kind of my sense out of a lot of that. But I know they have a certain job to do. I think it really is remarkable in this environment.
Meb: Thinking about allocations and being different we sent out today, the “Annual Yale Endowment Report,” and they have one of the most atypical allocations. Their U.S. stock exposure, I think, was 2.7%. Now, to be fair, they have some allocations that have a lot of what we would consider to be stock beta. So they have a lot of in venture capital, a lot in private equity and absolute returns, which, depending on how they do it, may look a lot stock like. But I guarantee you there’s probably not an institution, many in the country that would be comfortable saying to their board, “We have a 3% in U.S stocks.” You know, most it’s pretty darn near 60/40.
It’s always fun to watch for better or worse firms that tend to go way out on a limb. GMO recently had their forecast. I think I saw it was like a 15 percentage point spread between expected returns per year for U.S. stocks versus emerging value. So it’s fun to watch the ones that really are the…not necessarily just contrarian, but out there on a limb.
Doug: Yeah, I mean, I certainly admire people that know who they are. I mean, in terms of…I think one time GMO called their asset allocation approach remorselessly value-oriented. I mean, we use some momentum and relative strength. I mean, it’s certainly helped out with our long equities over the years. There’s no doubt about that.
But in terms of…and I’m glad you mentioned that incredible return spread that they’ve been forecasting for a long time, I don’t have the answer here, Meb. But a reservation that I’ve had on EM, well, they’re many, quite frankly. I mean, the demographics are not really a whole lot better than what we see in the U.S, and the U.S. is about the best in terms of the developed world in terms of potential labor force growth.
But I think the issue has to do that, even if the emerging markets generate substantially higher real GDP growth, or what I would argue is a more important measure, real GDP per capita growth over time. There’s no guarantee that it’s going to drop down to the bottom line or above the bottom line, let’s just say free cash flows for investors and publicly traded EM securities and a key reason is dilution. I mean, collectively, publicly-traded EM companies have been massive diluters of their stocks over the last 10 years at least. And I really haven’t looked at good data prior to that.
Whereas what’s happening here, obviously, is the equity share base has shrunk. We’ve taken a lot of companies private that sort of given us adverse selection in terms of more volatile lower-quality companies that are not good candidates for private equity. The large caps have been repurchasing shares until very recently. And I just wonder… And, again, it’s like one of these simple supply-demand things. But the EM companies have been net diluters over time, whereas we’ve been net shrinkers of the share base in the U.S.
Meb: You’re given a pitch for one of our strategies, shareholder yield. So yeah, we think that that’s a very important consideration. Those things tend to wax and wane over time and certain countries have more of a cultural shift we’ve seen, where Japan used to not be so shareholder friendly with regards to buybacks and dilution, but that’s sort of transitioned over the past decade or so. Hopefully, that’s the case in emerging, but we’ll see. Who knows?
What else is on your brain? What are you guys thinking about? Do you think coronavirus is gonna have some implications that people are not thinking about or are not pricing in? If we were to go back a time machine a year, and I was gonna say, Doug, I’m gonna give you this playbook of economic indicators for the next year. And PMI is gonna go from 50s to well below 50. Gold is gonna be up by 30%. Volatility is gonna be way up. Gold was ripping, unemployment goes from 3 to 15. Where do you think stocks are?
I imagine your answer, and it could be…probably wouldn’t be where they are. But it’s been a kind of unprecedented year. What do you think about coronavirus? Is there anything that in your conversations with asset owners or just what you guys are doing in-house that people aren’t thinking about that should?
Doug: I think the issue is the leverage that’s been built up in the system. And I’m not talking just corporate and personal debt. But when you have an expansion, a relatively low volatility, sluggish expansion that lasts over 10 years, I mean, that just reinforces behaviors that assumes more that is to come. And that’s why private equity was able to do what it’s done in the last five or six years, and add an extra turn or two of leverage to what it would have done on a deal, let’s say, in the last economic expansion. And that’s why I think this particular downturn has just been and will be so devastating in terms of earnings power. Because it was just not anything that was as close to a black swan as… Although I assume Taleb would argue it was a white swan, evidently, but pretty darn close to a black swan.
But if we didn’t have this operating leverage and all the private companies levered up, the earnings fallout would not have been as great. But three or four months ago that “The Economist” maybe more recent had a cover about the 90% economy. But if restaurants come back to only 90%, and that seems like…from what I’ve seen, that would be a gift. But if a year from now, they’re only at 90% of what they were doing a year ago, they’re not gonna make it. You can go down the line for so many businesses where a 90% recovery is just insufficient to sustain anything close to the earnings that investors are betting on.
And we did a piece just very simple as, you know, we do a lot of these historical comparisons in economic cycles. In the past… Okay, I talked a little bit about the gap earnings peak, which we made at the end of 2019. Well, if you exclude the inflationary recessions of, I guess, it’d be mid-70s, late ’70s, it’d be the double-dip or the early ’80s, where earnings recovered rapidly because inflation was so high. Let’s just take a look at low to moderate inflation, recessions, does this just make sense here, Meb? What I’m getting at is how long does it take to get back to the old earnings peak? Since we like to do a lot of stuff valuing earnings on prior cycle peaks and comparing growth from peak to peak, well, how long will it take us to get back to the old peak of 139.47 gap EPS that we recorded for all of 2019?
The median in just a normal economic downturn during low inflation times has been 17 quarters. I mean, the biggest bear on the street would not argue that we won’t see a new high in earnings until 2024. That’s been the experience. I’m just flabbergasted by where I see… And, of course, no one really focuses on gap earnings, it’s all this operating stuff. But the number I’ve seen on Bloomberg is still around 125 bucks. I don’t think there’s any way that we print in the three digits for 2020, even if COVID were to blow over pretty rapidly over the next few months. And, again, it’s the leverage in the system.
Meb: What else is on your brain? You got a curious mind you guys are always running studies. I love… Every month I’m impressed with talking about breadth thrusts and cycles and all sorts of different jokes and economic and political and sentiment. What else is on the brain?
Doug: You know, I mean, this is a little esoteric, but it’s really a simple concept. We talk sometimes about this. It’s called the Coppock curve, I might have mentioned it in our first discussion, but it’s really just a smooth rate of change on the stock market. And the best description… Anyone can reach out to me, I’ll send them the math for this indicator. But it’s just sort of like a year over year smoothed out rate of change on the stock market.
And then Steve Leuthold’s twist on it was we use that algorithm in our industry group selection system, among other things. And it’s been pretty good just for industries that in the past have cycled… I mean, the incredible thing to me is that we’re in the midst of what will turn out to be the worst recession in 80 years. I mean, there’s not any question about that, now it’s been unusual. But we had a 30…it was almost a 34% decline in the S&P 500, this Coppock curve, or as we call it, very long-term momentum never got oversold.
In other words… And the best description I’ve ever heard of this tool is it’s what the stock market looks like in people’s minds. So it’s almost as if, if you’re one of these John Bogle disciples that dutifully reinvest dividends, you know, as they come about and you don’t peek at your portfolio monthly or quarterly, you really didn’t experience anything upsetting in February and March. So this Coppock curve has only been in oversold territory for four months in the last decade. I mean, it’s incredible.
I mean, you talk about the Fed put, really becoming activated in the last three, four months, well, this chart would say it’s been there for over a decade. So of course that reinforces these risk-seeking behaviors. I mean, that’s why we’ve got the put-to-call ratio, the 21-day put-to-call ratio at a 20-year low. If you look at the numbers… By the way, not to plug all these other research outfits, but Jason Goepfert at SentimenTrader here on talent does a lot of work on parsing network into smart and dumb money.
But if you look at call and put activity by the small traders, I mean that put-to-call ratio is showing even more aggressive speculation. You got foreigners coming in late to the party, at least from a valuation perspective that are pouring money into U.S. stocks. You may remember the old market technician Justin Mamis wrote a newsletter for 50 years. He said once that foreigners and dentists are always the last to buy. So we’ve got the foreigners here for sure. But all this pretty wild speculative stuff, it stands to reason if you’ve never really suffered a sustained loss in capital for over a decade.
Just a lot of this cycle stuff. I mean, you need cycles, and the Fed just tries to mute them, and mute them, and mute them, and then what comes along are these really big downdrafts, like we had in 2000, 2002, 50%, and then 2007 to ’09, 57%.
Meb: It’s interesting you mentioned the Coppock curve. So I had started to write a paper back when I was a young enterprising analyst on the Coppock curve. I’ll have to dig it up, maybe we’ll eventually publish it. But it was just another example of it being… I mean, it’s been around since, I think, the ’60s, one of these old school technical indicators, and the simple takeaway is it worked great, but another fun one to put in the quiver. I’ll see if I can find it and dig it out and send it to you, or maybe even publish it. I got a few of those old papers that just never found the time to put into production.
Doug: I’d love to see it. You know, we’ve used it a lot of ways like cycle extensions. By the way… I mean, if we…and we’re not far here, we’re only 100 points on the S&P, 3% from making a new high. I mean, it will be the first cyclical bear market that would not have generated an oversold reading in the Coppock curve ever. And the proprietor of that, the creator of that… And you’re right, he disclosed it in the early ’60s, probably had it around for 20 years before that. That would be a low-risk buy signal when that thing turned up from oversold territory. So we didn’t have a low-risk opportunity even from VLT. Even at the March 23rd lows, most of our large-cap valuation measures were still 10% to 30% above the highest bear market low they’d ever seen. So all this historical stuff, it’s not serving people well.
And one thing, Meb, I will give a lot of the bulls credit here is that very few of them anymore are trying to make some tortured valuation argument for the market. I mean, I think that is just insulting to people’s intelligence when they try to do that. I mean, they’re just saying it’s a new game, all of this stimulus and money printing is gonna carry the day. And I just have more respect for that type of honesty than somehow trying to argue that stocks are cheap relative to this or that creative measure. And, of course, 20 years ago, cheap relative to clicks and eyeballs, that sort of thing. I don’t hear much of that bandied about among the bulls, so I’ll give them that much credit.
Meb: That brings back some fond memories. You talk about…you referenced Montgomery earlier. Another study I would love to do is to take, I don’t know, let’s call it 100 of the most important geopolitical events of the last century. You could do a couple hundred if you wanted to. But we’re talking about interns and Ph.D.s here. So maybe you have some on staff that would like to work on this. Or if you’re a Ph.D. candidate that’s gonna be working remote for the next year, hit me up, we can run it.
But basically, we wanna call the paper tomorrow’s newspaper today, and give you the headline of tomorrow’s newspaper. Now it can’t be directly market-related, it can’t be like the Dow is down 500 points. But it can be Pearl Harbor or whatever the big geopolitical event was, and then, say, “Can you forecast stock returns for the next month, six months, a year, whatever it may be, or even week, with a belief that even if you had a crystal ball into the future, you might get it wrong just by sheer chance and randomness of markets?” Anyway, it’s a fun study I wanna try out, so if you have any young, unused bandwidth over there, holler, or listeners, hit me up, it would be a fun paper to write.
Doug: And I think they would have to be young and unused because, at times, you know too much, you know what the outcome is gonna be.
Meb: Sure. I think you could get a large number of market participants and just do a study with a few thousand people online and give them a $5 Starbucks card or something for completing it, but we’ll talk about that later. Doug, before we let go, any other last thoughts? You guys do some work with, I know, elections and politics and everything else, any other areas that you think are interesting discussion?
Doug: It’s interesting, and maybe I should have made more of this fact. But the best window of the four-year presidential cycle…and this is sort of like some curve fitting that we did, is traditionally the last couple of months of the pre-election year, so that…or, I’m sorry, the midterm year, through January of the election year. So it’s a 15-month window and it’s just kind of interesting that that window close at the end of January of this year for what it’s worth. Of course, it contained that big December decline. But that stuff really has just been thrown off.
One of the fun things we’ve done, it just showed that the annual seasonal pattern, November through April, being the strong months, people illustrate those numbers with the S&P 500. But really the effect is more like a beta effect. So, historically, if you load up on small… One of my favourite stats, and I’d have to go back and update this for the latest collapse and rebound, but small caps have annualised… So this is Ibbotson data up until the formation of the Russell 2000 at the beginning of ’79.
But small caps annualised at about 22% or 23% total return in the months of November through April, obviously didn’t serve you well this year. But they’ve underperformed cash during the months of May through October. Going back…I mean, we’re coming up on 95 years of evidence. It’s just kind of interesting, people talk about all the reasons for the size, premium small caps. Well, they haven’t outperformed over the last 40 years, but over time they have, and it’s because of this size premium where really you’ve earned all this size premium and then some in a 6-month window of the calendar.
So it’d be fun for…it won’t be us, but someone may be out to launch a vehicle to try to capitalise on this. And, of course, you would have been hammered in the last 12 months. But over time… I mean, this has been well-known for 40, 50 years, and it just keeps on trucking. But that’s more recreational stuff, and it is clearly related to, you know, psychological biases. I mean, by the time we fully understand it, it will go away, but it hasn’t. I mean, that stuff is just kind of more recreational research. And if you’re a stock market junkie, I just kind of think it’s your responsibility to know about it.
Meb: I think you guys have reported on this, and correct me, but I don’t know who the original author was, but talking about stock returns as one of the best predictors of presidential elections. And I can’t remember if the timeframe is 3 months or 12 months leading up to the election, where the market is up, the incumbent party gets reelected, like, 80-some percent of the time, and if the market is down…
Doug: It’s great work, that was Jim Stack’s work. Boy, I’m plugging about everyone in this podcast. But no, it’s the three months leading up to…and I think it’s election eve. I mean, it would have predicted a Trump victory because the market slid, I mean, not much, but it was down. And I think he did it with the Dow Jones industrials, but it was like an 87% predictor. But that would have had Trump winning the last election. So that’s interesting, I mean, it’s just one variable, and it’s just a short window. But on the other hand, Meb, and you’re familiar with some of this work that we’ve done is that… I mean, sentiment is just so much a reflection of what the market has done recently.
So, sometimes, sentiment is not that informative. I mean, it’s like no surprise that the market is up 15% in the last 3 months. People are gonna be enthused, there’s not that much information there. But the three-month look back, that’s a really tight correlation with the investor’s intelligence, and the market vein, and the consensus, and all that stuff. So it’s interesting that Jim Stack found that.
Meb: Well, we’re recording this late July, so the egg timer is about to turn on for this three-month period. And I’m sure there might be have been, but I’m not certain…you guys talk about this, if there’s been a more stock market obsessed president…you could probably say he’s the first of a lot of things, but stock market obsessed president who tweets about the stock market all the time. I imagine if there’s anything in his power for the next three months to make sure that the economy and stock market is humming, he’s gonna do his best to throw it all at it. Because the betting markets have the Republicans at about plus 150 right now. So pretty big underdog for the presidential election. Will be fun to watch as always. Doug, this has been a blast. It’s getting dark in your part of the wood, almost.
Doug: Days are getting shorter, that’s for sure.
Meb: It’s been so much fun, thanks for joining us today. Where do people go if they wanna find out more what you guys are writing about, your investments, everything else, where do they go?
Doug: Well, there’s leutholdgroup.com and leutholdfunds.com. Our flagship vehicle is our core fund and it’s meant to… You know, as Steve Leuthold used to like to say, “It’s about making it and keeping it.” So you talked about three years ago, the possibility, you know, we acknowledge there’s a possibility, there could be a melt-up. I feel like some of the technical work has helped us catch a piece of that, not as large as I would have liked. But there’s a difference between acknowledging that can happen and wanting to play that. I mean, the best speculators in the world have stumbled trying to do that.
So we’re sort of in the middle of the road 50% invested position. And if sentiment gets sillier here, I mean, I imagine we’ll both reduce net equity exposure, but rotate into a little bit more forum. And we have a short fund.
Meb: Yeah. What is it, Grizz, something like that?
Doug: The Grizzly Fund.
Meb: I love it. Well, as we’re getting ready to go tramp around the wilderness in Colorado and Wyoming, I’m more than happy not to see any bears. But there’s probably no poor marketing department that I harass on a more consistent basis than Leuthold for access to charts and materials. So, listeners, definitely check out their website. They give away some free goodies. And hopefully, we can talk, Doug and company, into all the charts we couldn’t share today to maybe sharing them on the blog. So check out mebfaber.com for some of those as well. Doug, thanks so much for joining us today.
Doug: Thank you, Meb. Take care.
Meb: Podcast listeners, we’ll post show notes to today’s conversation at mebfaber.com/podcast. If you love the show, if you hate it, shoot us feedback@mebfabershow.com. We love to read the reviews. Please review us on iTunes and subscribe to the show, anywhere good podcasts are found. My current favourite is Breaker. Thanks for listening, friends, and good investing.
