Monthly Archives: June 2025

#3: “US Stocks Can Underperform Foreign Stocks For Way Longer Than You Think”

In our last piece, we examined just how long US stocks can go underperforming US bonds. The answer was, a lot longer than most could handle.

But what about a more comparable asset – stocks outside the US?

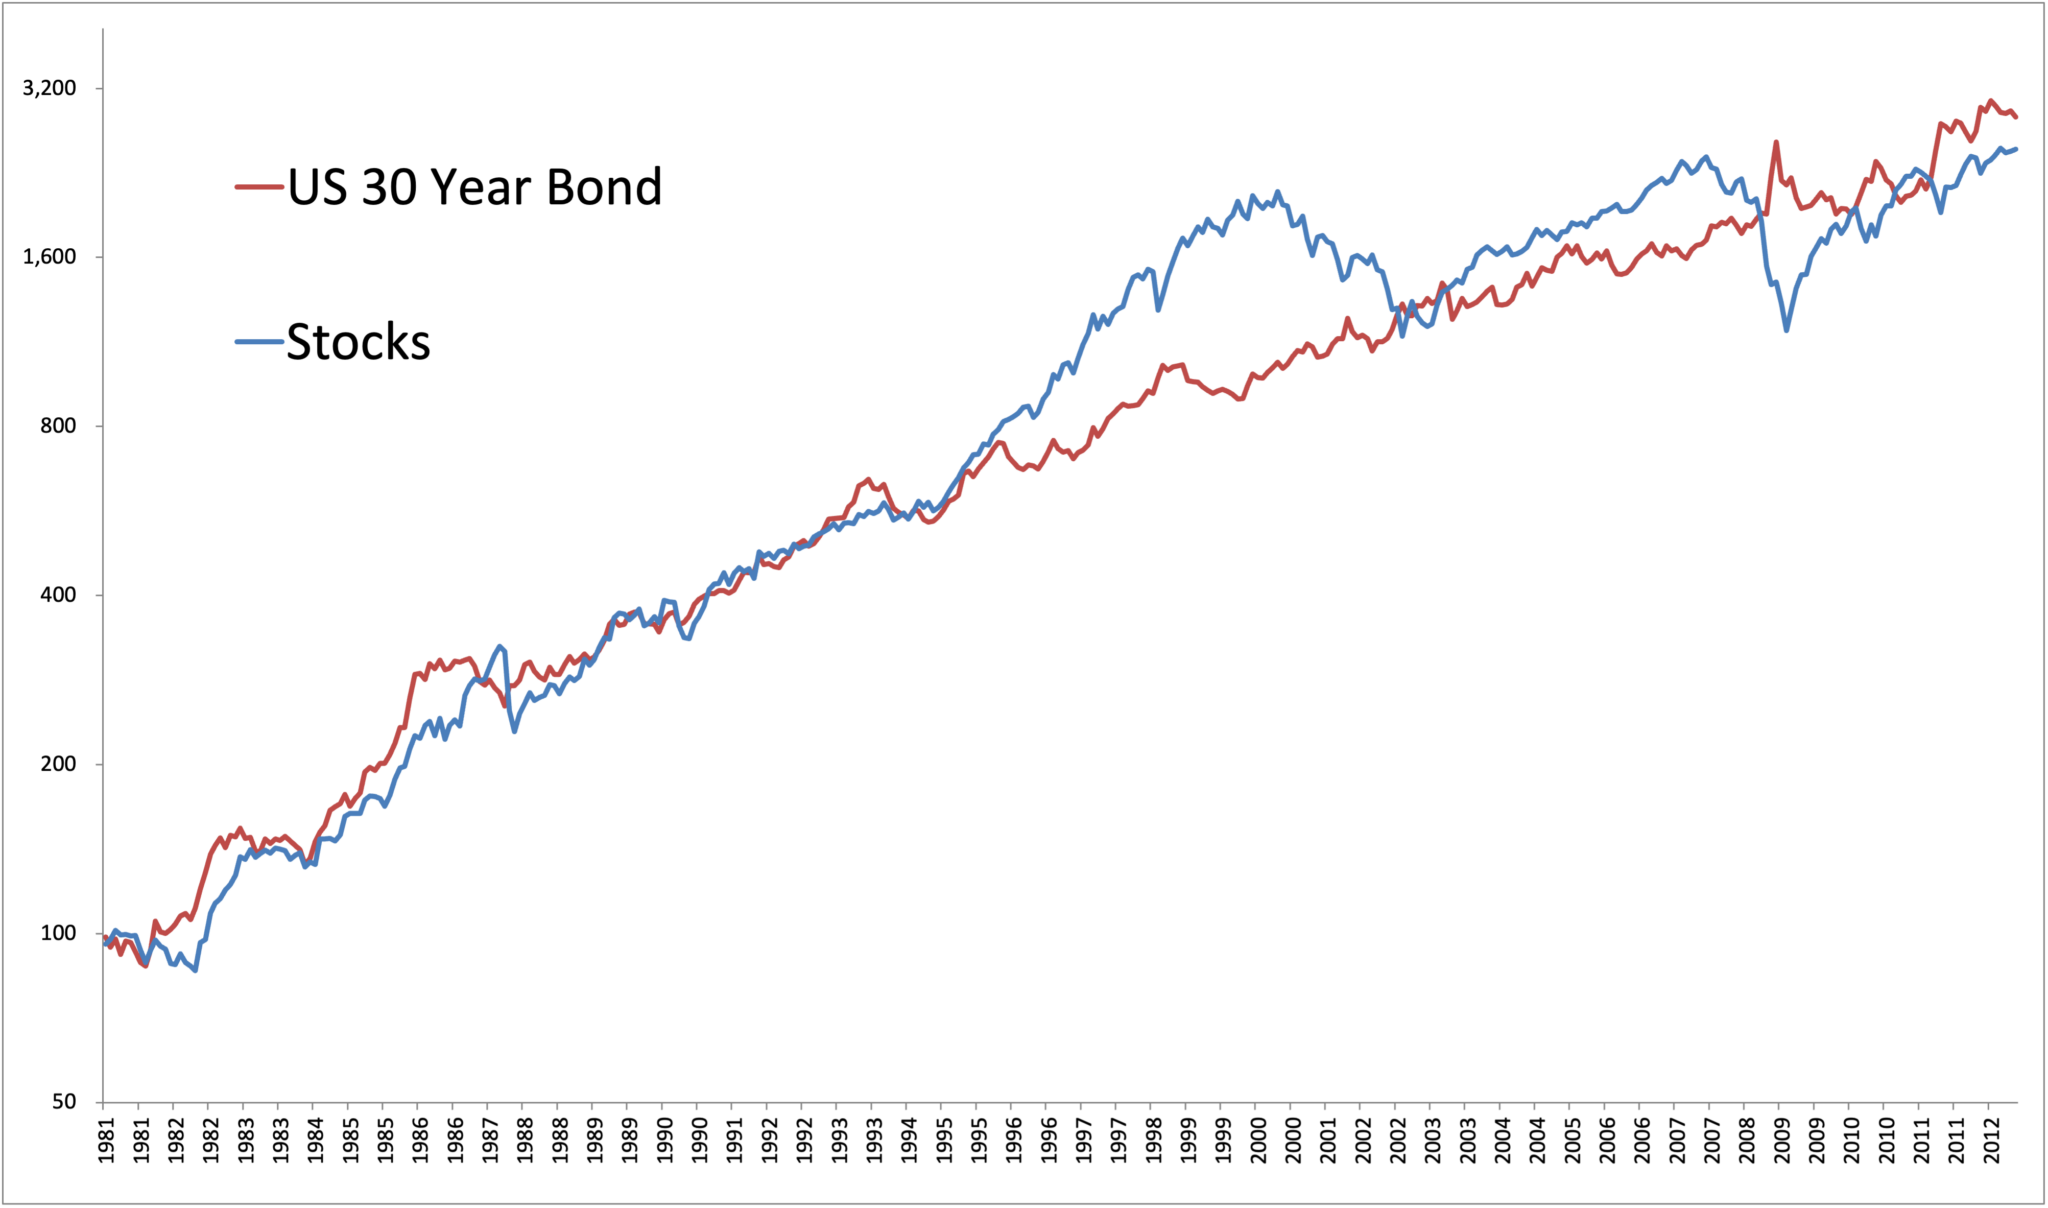
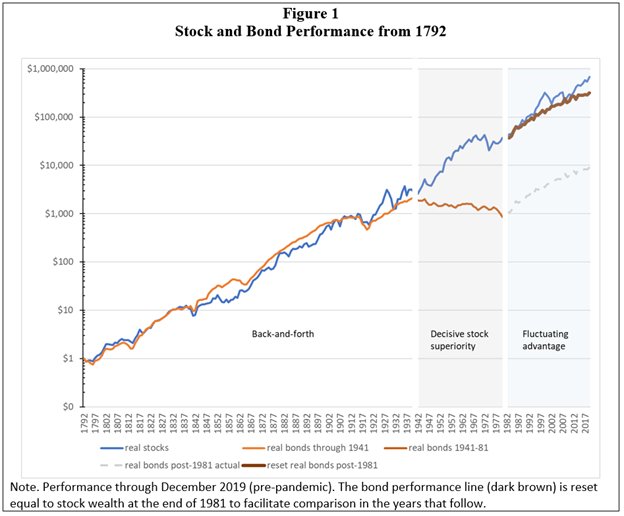
US stocks have trounced foreign stocks for as long as anyone can recall. Though as podcast alum Edward McQuarrie has pointed out, that might just be a case of “right hand chart bias“. That’s when an asset has performed well recently it looks like it has ALWAYS outperformed, even though there could be many periods of underperformance too. 

Here’s his example of US stocks vs. bonds:


What’s any of this have to do with US vs. foreign stocks? Well, Since the GFC in 2009, it’s felt like U.S. stocks could do no wrong, and you’ve made over 900%. For foreign stocks a measly 300%. 

America has been the belle of the global equity ball. But history has a funny way of humbling those who extrapolate recent trends forever.

Here’s the kicker: U.S. stocks can—and have—underperformed foreign stocks for decades.

Let’s rewind the tape. Many can recall the recent 2000 to 2010 decade, dubbed the “lost decade” for U.S. stocks, where the S&P 500 actually lost money. Meanwhile, foreign developed markets (think Europe, Japan, etc.) and especially emerging markets (hello, BRICs!) posted solid gains. It was the classic case of trees not growing to the sky.

The attached chart hammers this home. If you were sitting in the U.S.-only camp for the entirety of certain periods, you would’ve trailed globally diversified portfolios by a mile. And it’s not just cherry-picking—we’re talking decades-long stretches.

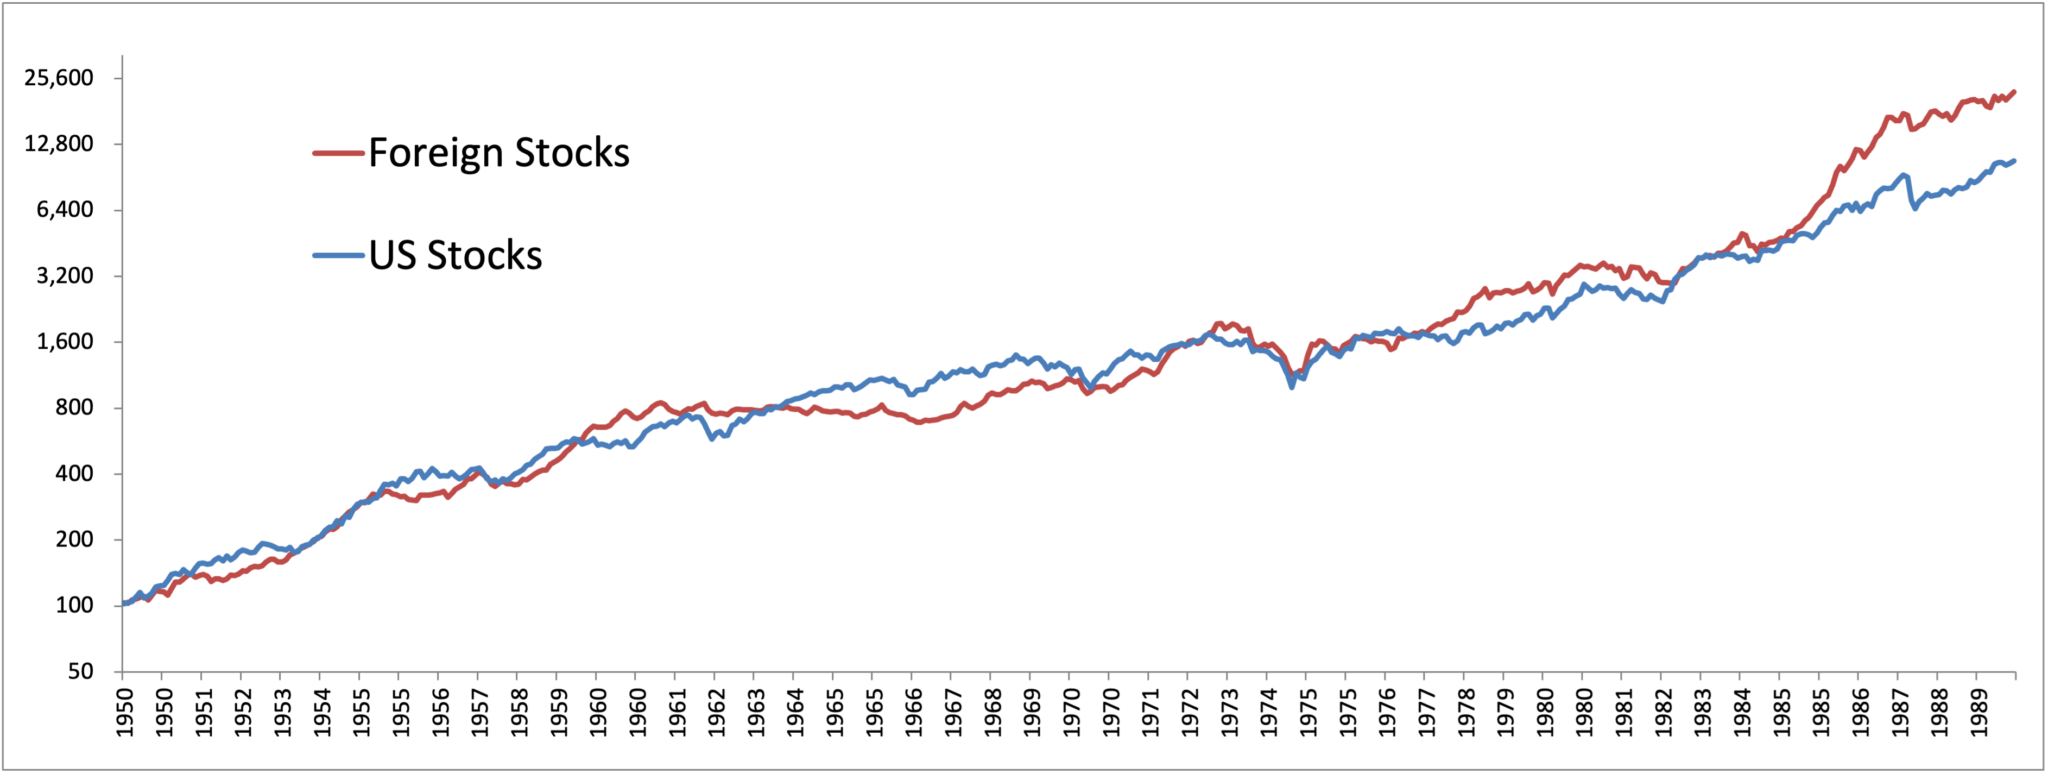
That was four decades from the 1950s through the 1980s. If you go back to the 1800s, foreign stocks outperformed the United States for 60 years at one point.

What if the outperformance lasted year after year? Try to imagine five or six years in a row?! Could never happen, right? It literally happened about 20 years ago, lol, and also in the 1980s. Investors often tend to extrapolate from the recent past, with US stocks outperforming foreign markets in 12 of the last 15 years. With significant foreign outperformance this year, is the Bear Market in Diversification ending? 

The key lesson? Diversification isn’t just a cute slogan—it’s a survival tactic.

Our home country bias blinds us.If you’re loading up on U.S. stocks after a 15-year run because it “feels right,” that’s your lizard brain talking. History says beware. Valuations matter. And when U.S. CAPE ratios are touching the stratosphere while foreign markets are lounging in the basement, future returns tend to follow the inverse path.

The solution? Own the haystack, not just the American needle. A global value tilt, rebalanced periodically, gives you a shot at participating when leadership changes—as it always does.

If your portfolio is a 100% U.S. allocation, it might be time to zoom out. There’s a whole world out there, literally.

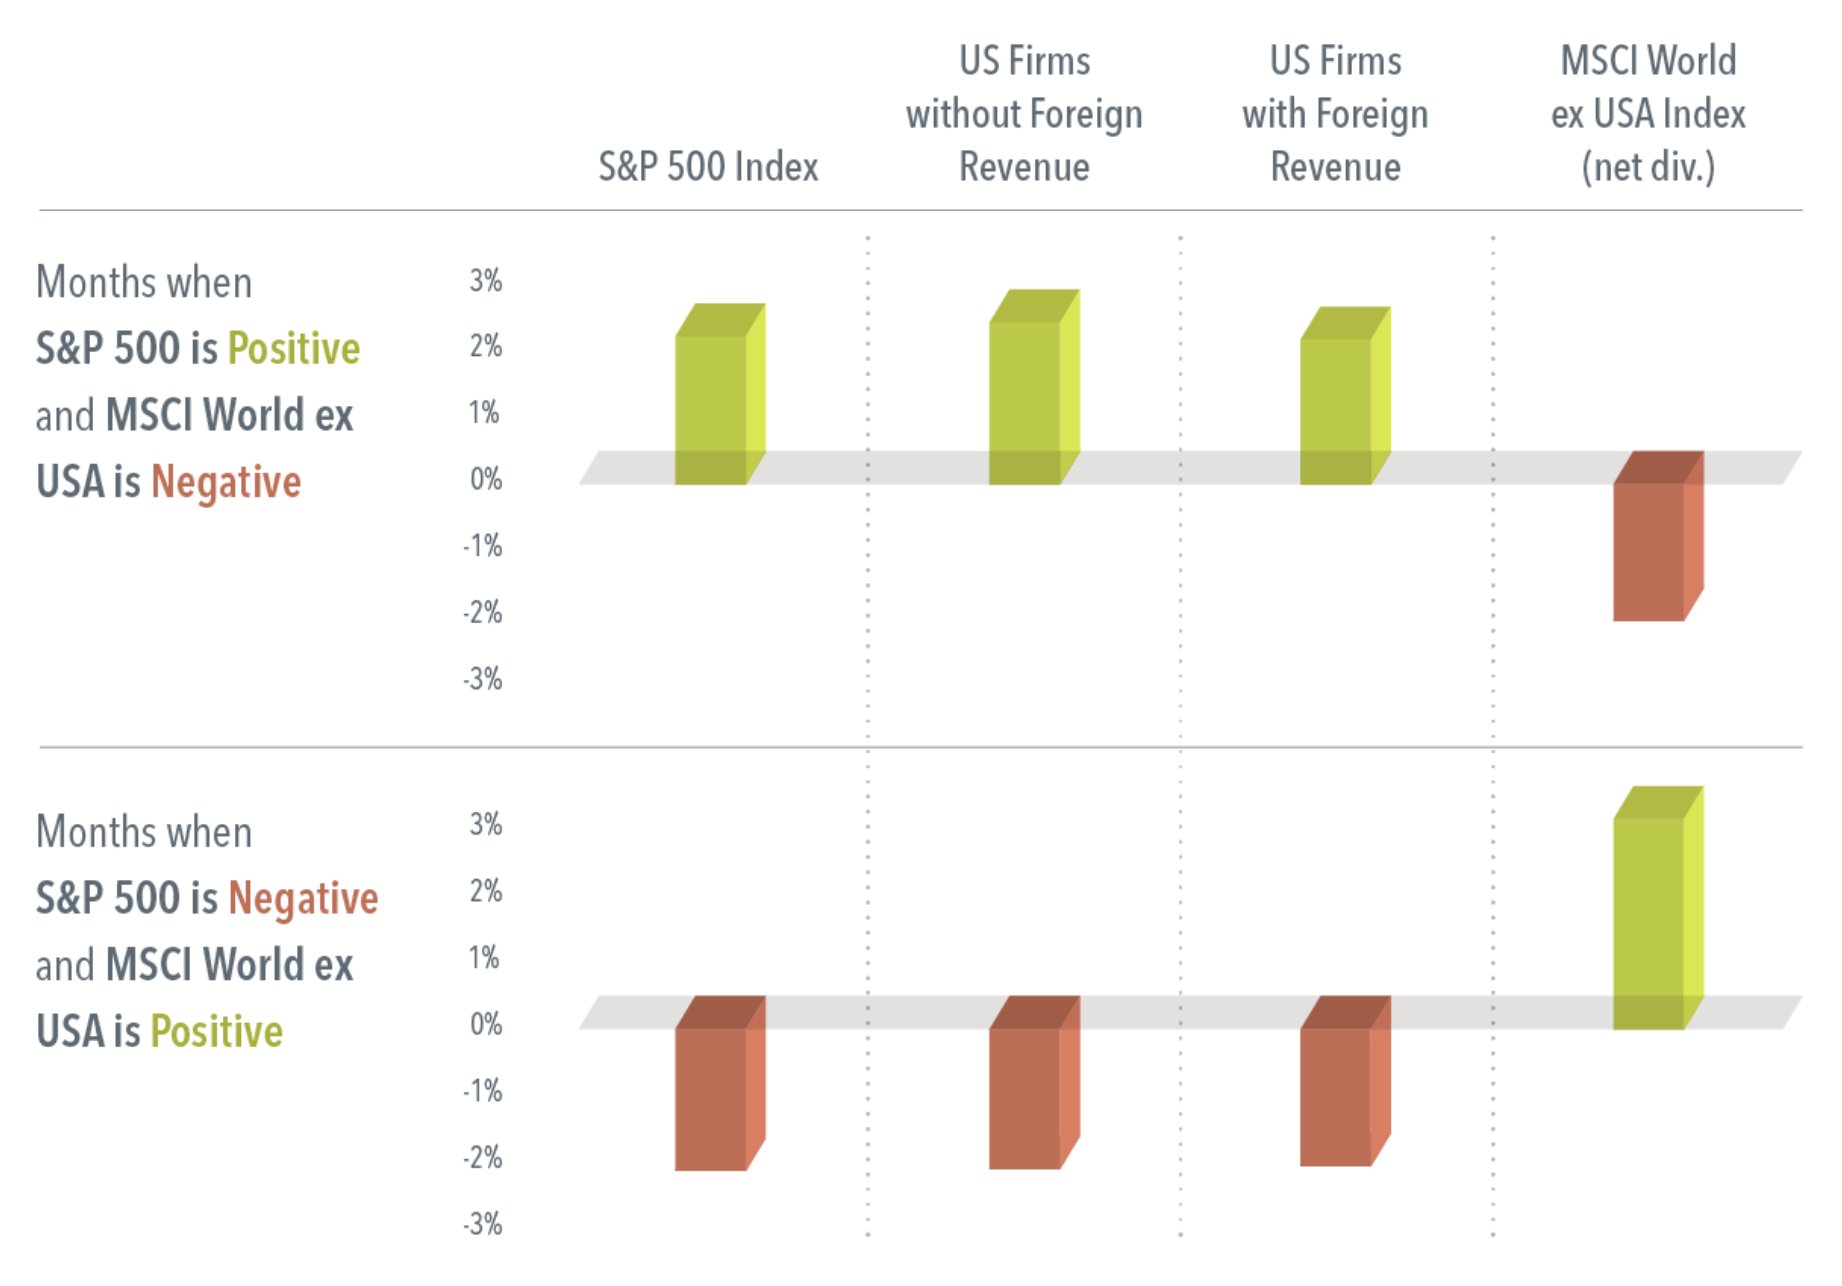
PS Many US investors put all their bets on US stocks. When we bring up the dangers of this “home country bias” then often respond that they have foreign exposure due to US companies having revenue from foreign countries. For those who think they can get their foreign exposure through US stocks with foreign revenue, turns out it doesn’t diversify the way you think it might. Partially, some of this will have to do with the movement of the US dollar vs. foreign currencies.

Here is a nice chart from Dimensional:


#2: “Stocks Can Underperform Bonds for a Long, Long Time”

If you asked the average investor to name the most iron rule of investing, they’d likely say: “Stocks outperform bonds.” And yes, over the long haul, that’s been true.

Since 1900 US stocks have returned 9.9% and 10-year US government bonds about 4.4%, a mile-wide gap. 

But the key question most folks never ask is… how long is long enough?

Most people would likely say a few years. True believers would say an entire decade. 


The problem is that history is a brutal teacher, and she doesn’t care about your expectations.

Most people could only last a short amount of time underperforming before giving up.  The correct answer to “What is the longest stretch of stocks underperformance vs. bonds?”

68 years.

Let that sink in.  You could theoretically go an entire lifetime without seeing any equity risk premium.

Now, this 68-year stretch occurred over 100 years ago, so you might be tempted to dismiss it.

In modern times, there have been multiple periods during which stocks have underperformed for decades.  (And this is just in the US…other countries have suffered far, far worse…) Given the results of my Twitter poll, it means many respondents would likely bail on stocks much sooner.

Let’s zoom in on this century.  If you plowed money into U.S. stocks at the start of the century, you got whacked with two massive drawdowns—the dot-com bust and the GFC. And despite a heroic recovery post-2009, stocks still couldn’t outrun a basic bond portfolio over the full stretch.

Two. Decades.

Think about that. An entire investing generation—new grads, young families, retirees—could have spent their whole working life watching the “safe” stuff quietly outperform the market darling. And let’s be clear: we’re not talking fancy hedge funds or tactical alphas. This is a plain-vanilla, middle-of-the-road bond portfolio.

If you used the 30-year bond you could take it back to 1980…or three, perhaps four decades of no material equity premium.

Why does this matter? Because it flies in the face of one of the most ingrained assumptions in finance. And because most investors—retail and pro alike—chronically underestimate the length and depth of underperformance that can happen in markets. We’ve just experienced massive stock outperformance over bonds over the past 15 years. Will that continue forever?

We’re taught to think of bonds as ballast. Income-generating sleep aids. But there are times when they’re the better bet—not in hindsight, but in real time, if you’re paying attention to valuation and risk premiums.

What’s the takeaway?

  1. Stocks don’t always win.
  2. Timeframes matter. A lot.

Diversification isn’t just a nice idea—it’s survival. And if your allocation is anchored in dogma (“stocks for the long run!”), you might be in for a rude awakening when “long run” turns into “not in your lifetime.”

Chasing Buffett: Can You Get Berkshire Returns Without the Oracle?

Some of you may have seen that I built a customGPT trained on all my blogs, papers, books, and podcasts. You can even go talk to it (me?) here:

MEB AI

Ask it a few questions, does it sound like me?

Anyways, we asked it to help write the below piece…not bad!

Chasing Buffett: Can You Get Berkshire Returns Without the Oracle?

Everyone wants to be Warren Buffett. Or at least, own Berkshire Hathaway and sit back while it compounds quietly into retirement. But here’s the trillion-dollar question: can you engineer Buffett-like returns without the Buffett brain?

Let’s run an experiment.

We pulled from Pim van Vliet’s “High Returns from Low Risk” dataset—and built a portfolio using the Conservative Formula: the 100 least volatile U.S. stocks with high shareholder yield and positive momentum. Think of it as Buffett meets factor investing. (His book is great too…)

From 1965 to 2023, we lined it up side-by-side with Berkshire’s performance. We also added a splash of leverage. Nothing crazy—1.25x to 1.5x—just enough to give it some rocket fuel.

Here’s what we found:

  • The unleveraged Conservative Formula delivered ~14% CAGR with 16% volatility and 25% drawdowns. Better Sharpe ratio than Berkshire. 

  • Add modest leverage and you’re sitting at 18–19% returns. Max drawdowns? Around 40%. Sharpe still healthy.

  • Try that same leverage on the higher-volatility portfolios, and it’s a dumpster fire. Portfolio 9 gave back 96% at one point. Yikes.

So what’s the takeaway?

Low-volatility stocks are boring. But boring works. Add a bit of leverage and you’re sniffing Berkshire-like returns—without stock picking, without market timing, and without 50 years of reading 10-Ks on a Saturday night.

Quick Scorecard:

Strategy CAGR Max Drawdown Sharpe
Berkshire 19.1% -50% 0.53
Conservative (Unleveraged) 14% -25% 0.73
Conservative (Leveraged) ~18.7% -40% 0.68
S&P 500 10% -38% 0.48

Final Thought

Want to compound wealth like Buffett? You don’t have to clone his stock picks. You just need to avoid the landmines—deep drawdowns, excessive volatility—and lean on what works: shareholder yield, momentum, and volatility as a risk filter. Sprinkle in some thoughtful leverage, and you’ve got a scalable engine for long-term wealth compounding.


20 Things You May Not Know About Markets (or That Might Surprise You). #1 – Normal Stock Market Returns are Extreme

We’re starting a new series here that will eventually be a short paper, but thought we’d drip these articles out every week over the course of the summer….enjoy!

#1 – Normal stock market returns are extreme

Most investors understand that stocks return about 10% per year over time.

However, many investors may not appreciate the volatile path that stocks often take to achieve this 10% return. It’s not a steady 10%, 10%, 10%.

Over the past 125 years, the average up year in markets was 21%!

The average down year is -14%.

There are about three times as many up years as down years. In fact, there are more 25% or more up years than down years.

But the down years still happen, and when they do, they’re scary. The more volatile small caps average near a bear market decline every year.

Staying the course can be tough on the path to 10%.

Thanks to our intern Ava for the chart and to Ken Fisher for the inspiration!


Want to Make the BIG Money?

If you ask most people who makes the big money, they’ll likely say athletes like Ronaldo or celebrities like Taylor Swift.

Some might respond CEOs of giant companies like Apple’s Tim Cook.

Hedge fund managers make more than both combined by an order of magnitude.

Taxes Matter

“We estimate that the ETF tax efficiency has increased long-term investors’ after-tax returns by 1.05% per year relative to mutual funds in recent years.”

The Role of Taxes in the Rise of ETFs

ETF Performance vs. Fees & Assets Under Management (AUM)

We did a fun little study comparing the average Morningstar Star Rating vs. fees on the funds. We examined all ETF companies with at least five rated funds, resulting in approximately 50 companies.

What we found would make sense: the most expensive group of funds tended to be the worst performers. But once you get rid of the most expensive quartile, the average Morningstar rating is about the same. (This has been well known for at least a decade…)

While the mega firms of Vanguard, Fidelity, and Schwab are all represented in the top 10 average rating (8-10), the top seven firms are all smaller boutiques with assets around $1 – $10 billion.

Hat tip to Anvith for the help and Morningstar for the inspiration. 


So…Much…To…Read….

You can now find all of our white papers on SSRN….enjoy!

Meb’s White Papers on SSRN

How Long Can US Stocks Underperform Foreign Stocks?

Imagine waiting almost FOUR DECADES for US stocks to outperform. Crazy right?

That was 1952-1989.

If you go back to the 1800s, foreign stocks outperformed the United States for 60 years at one point.

What if the outperformance lasted year after year? Try to imagine five or six years in a row?! Could never happen, right? It literally happened about 20 years ago, lol, and also in the 1980s.

Investors often tend to extrapolate from the recent past, with US stocks outperforming foreign markets in 12 of the last 15 years. With significant foreign outperformance this year, is the “Bear Market in Diversification” ending?


Flows Crown

Regardless of your views on crypto, you need to pay attention to big boy flows like this.

“the fastest ETF to ever hit that mark in only 341 days, which is 5x faster than the old record held by GLD of 1,691 days. “

via @Balchunas