Below we have updated our 2006 white paper. While you can download the full 70+ page paper here, I’ve also chopped it up into a series of more digestible posts for the blog.
Updates included in the 2013 paper include:
1. Results are extended to include the years 2009-2012.
2. Additional asset classes are included (from 5 to 13, although still includes results from original 5 model).
3. Alternative cash management strategies are included.
4. Additional conservative and aggressive approaches are included.
5. Alternative allocations are included.
6. References translated into hyperlinks.
ABSTRACT
In this paper we update our 2006 white paper “A Quantitative Approach to Tactical Asset Allocation” with new data from the 2008-2012 period. How well did the purpose of the original paper – to present a simple quantitative method that improves the risk-adjusted returns across various asset classes – hold up since publication? Overall, we find that the models have performed well in real-time, achieving equity like returns with bond like volatility and drawdowns. We also examine the effects of departures from the original system including adding more asset classes, introducing various portfolio allocations, and implementing alternative cash management strategies.
INTRODUCTION
Much has happened in the world since the original publication of this white paper in 2006. However, change has always been the constant, and indeed has anything new really been seen in our world of investing? Bubbles, defaults, government interventions, bear markets, downgrades, quantitative easing, fortunes made and lost – they’ve all happened before. (For a lengthy examination of bubbles, see our paper “Learning to Love Investment Bubbles”.)
Since publication of the original paper we have seen a devastating bear market in 2008 – 2009. The normal benefits of diversification disappeared as many non-correlated asset classes experienced large declines simultaneously. Commodities, REITs, and foreign stock indices all suffered drawdowns over 50%. (Drawdown is the peak-to-trough decline an investor would experience in an investment, and we calculate it here on a monthly basis.) The classic barometer of stocks, the S&P 500 Index, declined 36.77% in 2008 alone.
The fantastic book Triumph of the Optimists: 101 Years of Global Investment Returns (and 2012 update here), illustrates that many global asset classes in the twentieth century produced spectacular gains in wealth for individuals who bought and held those assets for generation-long holding periods, but the assets also went through regular and painful drawdowns like 2008. All of the G-7 countries have experienced at least one period where stocks lost 75% of their value. The unfortunate mathematics of a 75% decline require an investor to realize a 300% gain just to get back to even – the equivalent of compounding at 10% for 15 years!
For some long term perspective, below are some long term charts based on the data from Morningstar / Dimson Marsh Staunton. Below are the best, middle, and worst case scenarios for the main asset classes of sixteen countries from 1900-2011. All are real return series on a log graph (except the last one).
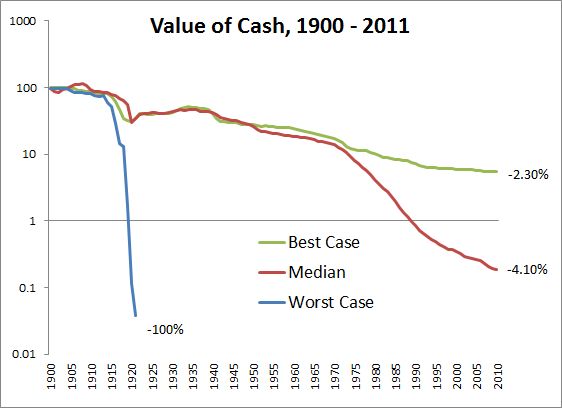
First, here are the best cases for returns on your cash. This chart goes to show that leaving cash under your mattress is a slow bleed for a portfolio. Germany is excluded after the first series as it dominates the worst case scenarios (in this case hyperinflation).
Chart 1 – Cash Real Returns, 1900-2011
Best Case: -2.30% per year
Middle: -4.10%
Worst Case: -100%
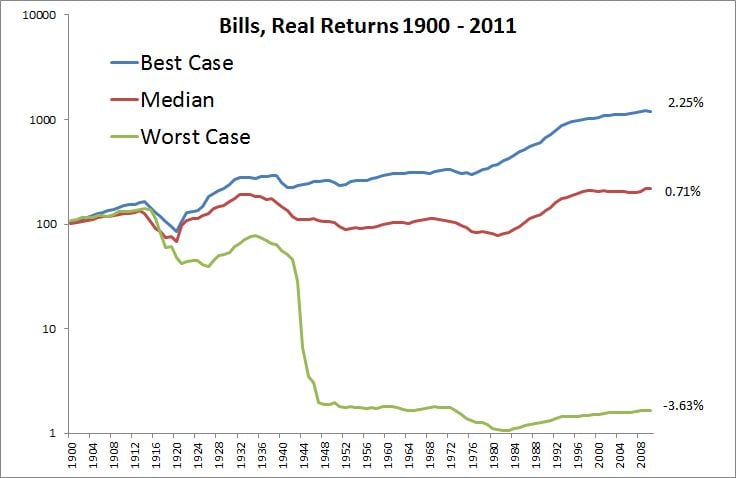
Next up is real returns for short term government bills.
Chart 2 –Short Term Government Bills Real Returns, 1900-2011
Best Case: 2.25% per year
Middle: 0.71%
Worst Case: -3.63%
(Real Worst Case, Germany -100%)
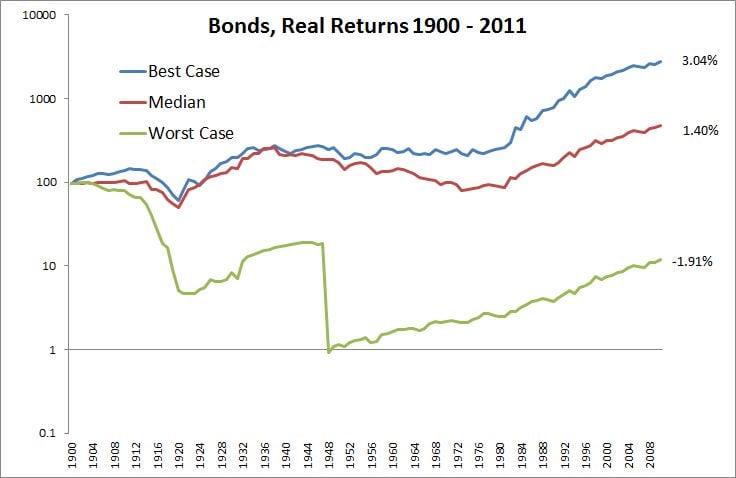
Followed by the real returns for longer dated bonds:
Chart 3 –Long Term Government Bonds Real Returns, 1900-2011
Best Case: 3.04% per year
Middle: 1.40%
Worst Case: -1.91%
(Real Worst Case, Germany -100%)
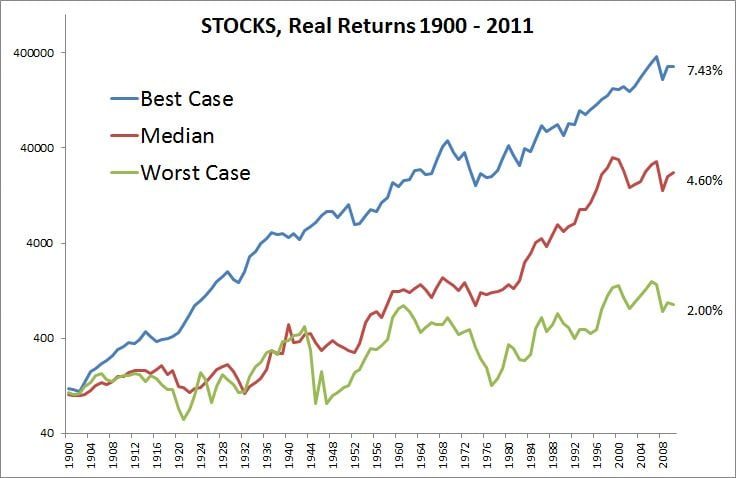
And finally, the real returns for equities.
Chart 4 –Stocks Real Returns, 1900-2011
Best Case: 7.43% per year
Middle: 4.60%
Worst Case: 2.00%
(Real Worst Case, China, Russia -100%)
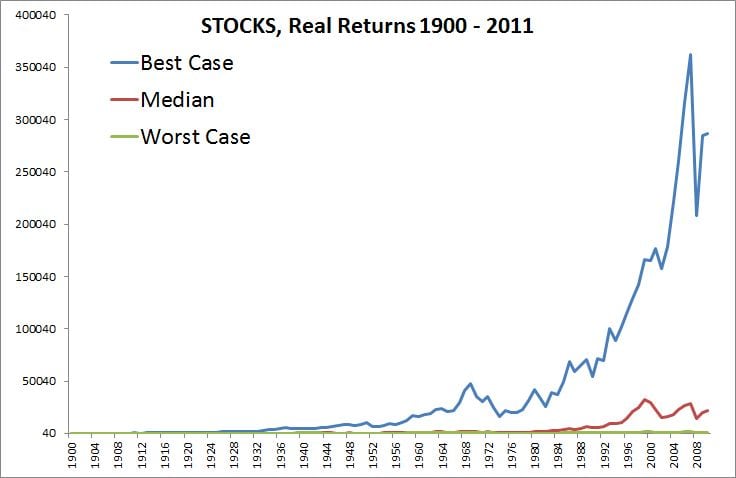
And the same chart presented non-log…
Individuals invested in U.S. stocks in the late 1920s and early 1930s, German asset classes in the 1910s and 1940s, Russian stocks in 1927, Chinese stocks in 1949, U.S. real estate in the mid-1950s, Japanese stocks in the 1980s, emerging markets and commodities in the late 1990s, and nearly everything in 2008, would reason that holding these assets was a decidedly unwise course of action. Most individuals do not have a sufficiently long time frame to recover from large drawdowns from risky asset classes.
However, also since the recent update of this paper in 2009, we have seen a strong recovery in many of the world markets. While some markets are still down considerably from their peak values, here in the US stocks and bonds are trading near or at all-time highs including dividends.
Most importantly for any investor is that they have a plan and process for investing in any environment, regardless of how improbable or unfathomable that may be. Are you prepared for all of the possible outcomes, such as declines of 50-100% in your asset class or portfolio? Are you prepared for currency devaluations, but also massive rallies in stocks or bonds? Can you fathom a world with interest rates at 0.1% as well as at 10%?
