I have been contemplating writing a book or white paper on asset allocation strategies. But like many pieces I have started to write this summer, I have simply ended up condensing an entire 200 page book into one blog post. Maybe it is a case of summer-itis, but I seem to be following the old Thoreau quote – simplify, simplify, simplify.
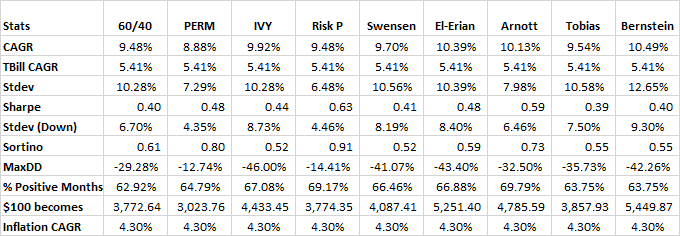
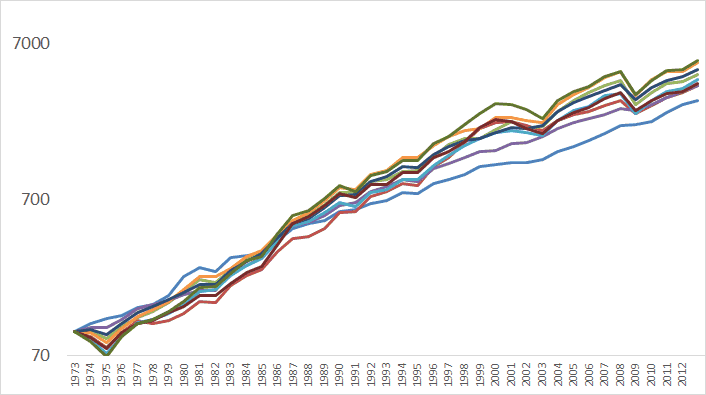
Below are a handful of the most popular asset allocation strategies from lots of different gurus. I did my best to recreate their allocations from public asset classes back to the 1970s. So which asset allocation strategy performed best?
Scroll to the bottom to find out!
60/40
60% US Stocks
40% US 10 Govt Bonds
Swensen Portfolio (Source: Unconventional Success, 2005)
30% US Stocks
20% REITs
20% Foreign Stocks
15% US Govt Short Term
15% TIPS
El-Erian Portfolio (Source: When Markets Collide, 2008)
15% US Stocks
15% Foreign Developed Stocks
12% Foreign Emerging Stocks
7% Private Equity
5% US Bonds
9% International Bonds
6% Real Estate
7% Commodities
5% TIPS
5% Infastructure
8% Special Situations
Arnott Portfolio (Source: Liquid Alternatives: More Than Hedge Funds, 2008)
10% US Stocks
10% Foreign Stocks
10% Emerging Market Bonds
10% TIPS
10% High Yield Bonds
10% US Govt Long Bonds
10% Unhedged Foreign Bonds
10% US Investment Grade Corporates
10% Commodities
10% REITs
Permanent Portfolio (Source: Fail-Safe Investing, 1981 )
25% US Stocks
25% Cash (T-Bills)
25% US Long Bonds
25% Gold
Andrew Tobias Portfolio (Similar to Bill Shultheis & Scott Burns’s 3 Fund portfolios)
33% US Stocks
33% Foreign Stocks
33% US Bonds
William Bernstein Portfolio (Source:The Intelligent Asset Allocator, 2000 )
25% US Stocks
25% Small Cap Stocks
25% International Stocks
25% Bonds
Ivy Portfolio (Source: Ivy Portfolio, 2009)
20% US Stocks
20% Foreign Stocks
20% US 10Yr Gov Bonds
20% Commodities
20% Real Estate
Risk Parity Portfolio (Unlevered, Faber PPT)
7.5% US Stocks
7.5% Foreign Stocks
35% US 10 Year Bonds
35% Corporate Bonds
5% GSCI
5% Gold
5% Real Estate
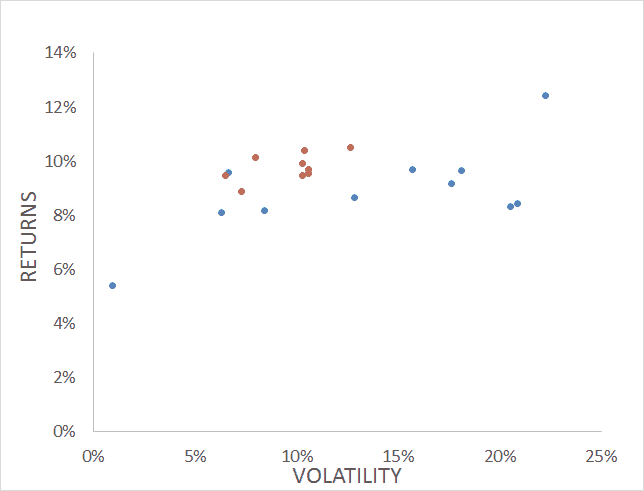
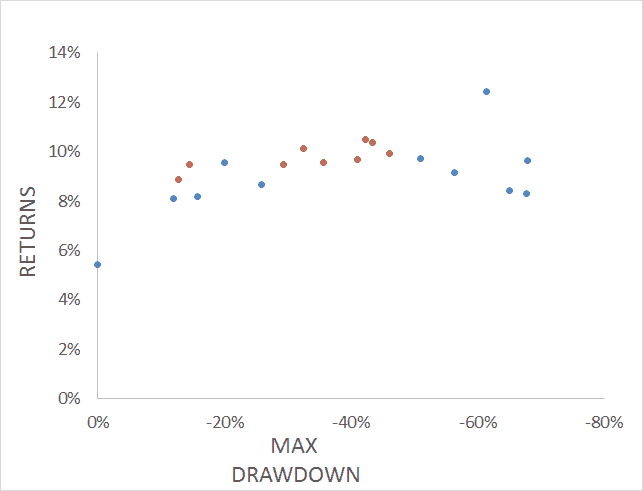
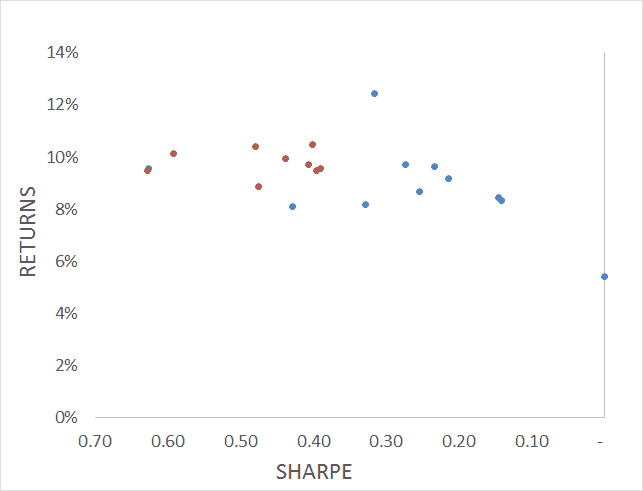
Below are three charts. The first is returns vs. volatility, the second is returns vs. maximum drawdown, and the third is returns vs. Sharpe Ratio. As you can see, they all performed pretty similarly. People spend countless hours refining their beta allocation, but for buy and hold, these allocations were all within 200 basis points of each other!
A rule of thumb we talked about in our book is that over the long term, Sharpe Ratios cluster around 0.2 for asset classes, and 0.4 – 0.6 for asset allocations. You need to be tactical or active to get above that.
Blue dots are generic asset classes, red dots are the portfolios from above.
What’s the takeaway? Go enjoy your summer.